


Alternative catalytic residues in the active site of Esco acetyltransferases
Ajam, T., De, I., Petkau, N., Whelan, G., Pena, V., Eichele, G.(2020) Sci Rep
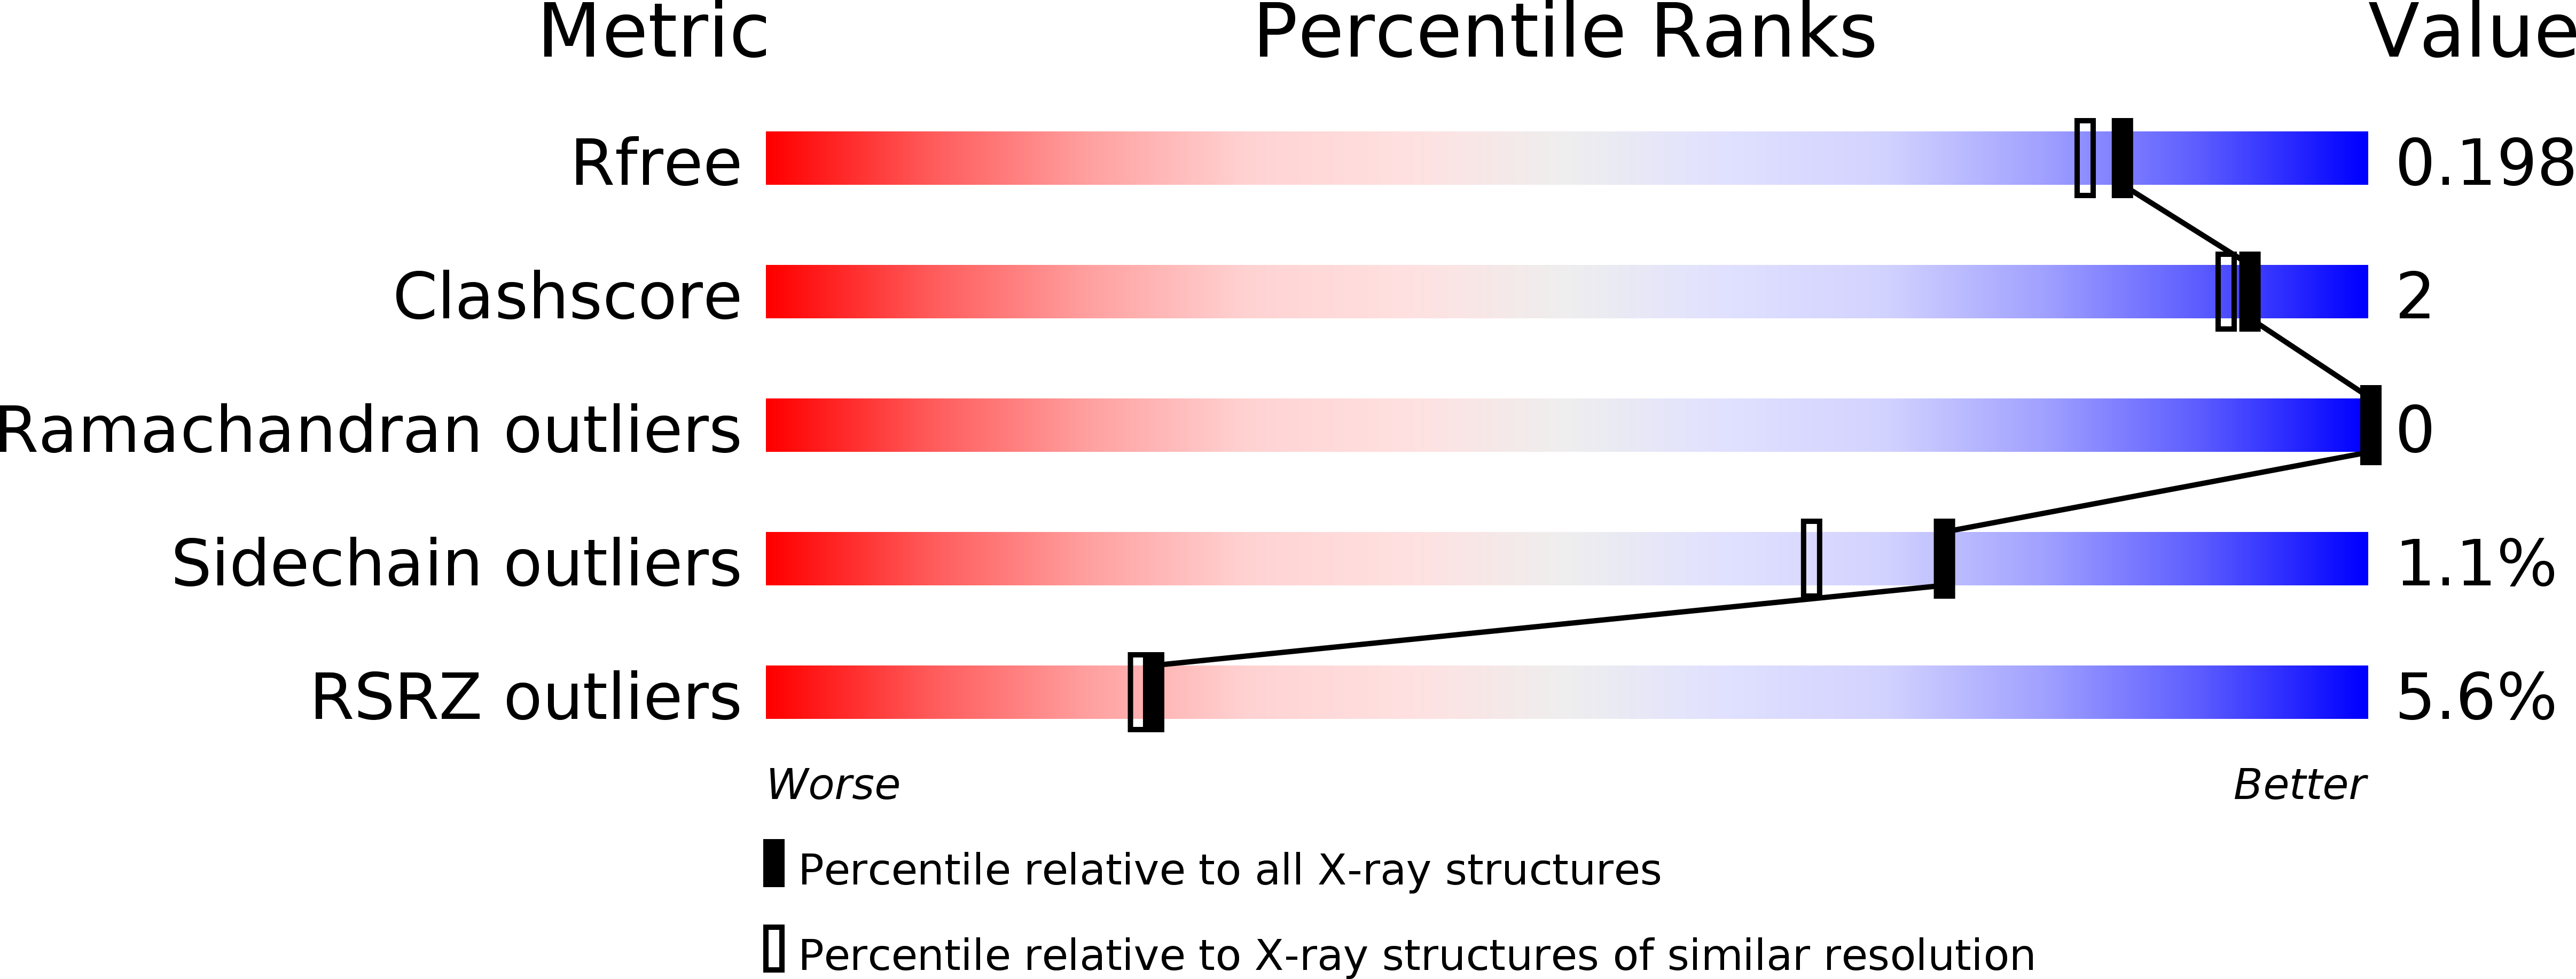
Experimental Data Snapshot
(2020) Sci Rep
Entity ID: 1 | |||||
|---|---|---|---|---|---|
| Molecule | Chains | Sequence Length | Organism | Details | Image |
| N-acetyltransferase ESCO2 | 226 | Mus musculus | Mutation(s): 0 Gene Names: Esco2 EC: 2.3.1 | 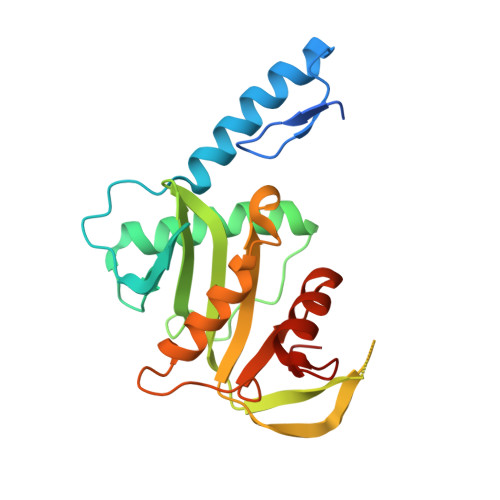 | |
UniProt | |||||
Find proteins for Q8CIB9 (Mus musculus) Explore Q8CIB9 Go to UniProtKB: Q8CIB9 | |||||
Entity Groups | |||||
| Sequence Clusters | 30% Identity50% Identity70% Identity90% Identity95% Identity100% Identity | ||||
| UniProt Group | Q8CIB9 | ||||
Sequence AnnotationsExpand | |||||
| |||||
| Ligands 2 Unique | |||||
|---|---|---|---|---|---|
| ID | Chains | Name / Formula / InChI Key | 2D Diagram | 3D Interactions | |
| COA (Subject of Investigation/LOI) Query on COA | B [auth A] | COENZYME A C21 H36 N7 O16 P3 S RGJOEKWQDUBAIZ-IBOSZNHHSA-N |  | ||
| ZN (Subject of Investigation/LOI) Query on ZN | C [auth A] | ZINC ION Zn PTFCDOFLOPIGGS-UHFFFAOYSA-N |  | ||
| Length ( Å ) | Angle ( ˚ ) |
|---|---|
| a = 52.68 | α = 90 |
| b = 52.68 | β = 90 |
| c = 107.47 | γ = 90 |
| Software Name | Purpose |
|---|---|
| PHENIX | refinement |
| PHENIX | refinement |
| PDB_EXTRACT | data extraction |
| XDS | data reduction |
| XDS | data scaling |
| PHENIX | phasing |
RCSB PDB (citation) is hosted by
RCSB PDB is a member of the

