


Crystal structure of Acetyl-CoA acetyltransferase from Elizabethkingia anophelis NUHP1
Abendroth, J., Fox III, D., Lorimer, D.D., Edwards, T.E.To be published.
Experimental Data Snapshot
wwPDB Validation 3D Report Full Report

Entity ID: 1 | |||||
|---|---|---|---|---|---|
| Molecule | Chains | Sequence Length | Organism | Details | Image |
| Acetyl-CoA acetyltransferase | 401 | Elizabethkingia anophelis NUHP1 | Mutation(s): 0 Gene Names: BD94_2261 EC: 2.3.1.9 | 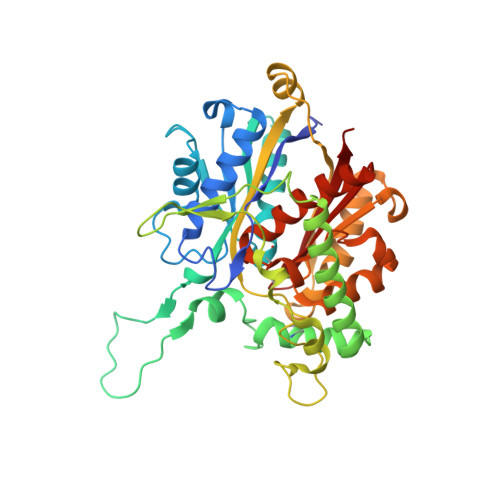 | |
UniProt | |||||
Find proteins for A0A077EEP0 (Elizabethkingia anophelis NUHP1) Explore A0A077EEP0 Go to UniProtKB: A0A077EEP0 | |||||
Entity Groups | |||||
| Sequence Clusters | 30% Identity50% Identity70% Identity90% Identity95% Identity100% Identity | ||||
| UniProt Group | A0A077EEP0 | ||||
Sequence AnnotationsExpand | |||||
| |||||
| Ligands 3 Unique | |||||
|---|---|---|---|---|---|
| ID | Chains | Name / Formula / InChI Key | 2D Diagram | 3D Interactions | |
| GOL Query on GOL | F [auth A] | GLYCEROL C3 H8 O3 PEDCQBHIVMGVHV-UHFFFAOYSA-N |  | ||
| CA Query on CA | B [auth A], C [auth A], D [auth A] | CALCIUM ION Ca BHPQYMZQTOCNFJ-UHFFFAOYSA-N |  | ||
| CL Query on CL | E [auth A] | CHLORIDE ION Cl VEXZGXHMUGYJMC-UHFFFAOYSA-M |  | ||
| Modified Residues 1 Unique | |||||
|---|---|---|---|---|---|
| ID | Chains | Type | Formula | 2D Diagram | Parent |
| SCY Query on SCY | A | L-PEPTIDE LINKING | C5 H9 N O3 S |  | CYS |
| Length ( Å ) | Angle ( ˚ ) |
|---|---|
| a = 99.17 | α = 90 |
| b = 167.42 | β = 90 |
| c = 72.56 | γ = 90 |
| Software Name | Purpose |
|---|---|
| XSCALE | data scaling |
| PHENIX | refinement |
| PDB_EXTRACT | data extraction |
| XDS | data reduction |
| MoRDa | phasing |
RCSB PDB (citation) is hosted by
RCSB PDB is a member of the

