5AJG

Structure of Infrared Fluorescent Protein IFP1.4 AT 1.11 Angstrom resolution


Experimental Data Snapshot

  • Method: X-RAY DIFFRACTION
  • Resolution: 1.11 Å
  • R-Value Free: 0.168 
  • R-Value Work: 0.146 
  • R-Value Observed: 0.147 

wwPDB Validation   3D Report Full Report


Ligand Structure Quality Assessment 


This is version 1.4 of the entry. See complete history


Literature

Structural Determinants of Improved Fluorescence in a Family of Bacteriophytochrome-Based Infrared Fluorescent Proteins: Insights from Continuum Electrostatic Calculations and Molecular Dynamics Simulations.

Feliks, M.Lafaye, C.Shu, X.Royant, A.Field, M.

(2016) Biochemistry 55: 4263

  • DOI: https://doi.org/10.1021/acs.biochem.6b00295
  • Primary Citation of Related Structures:  
    5AJG

  • PubMed Abstract: 

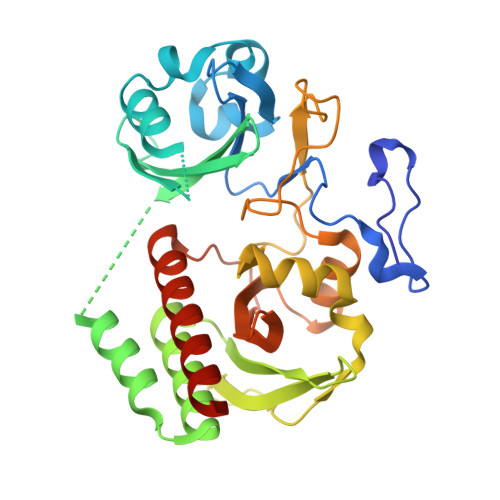
    Using X-ray crystallography, continuum electrostatic calculations, and molecular dynamics simulations, we have studied the structure, protonation behavior, and dynamics of the biliverdin chromophore and its molecular environment in a series of genetically engineered infrared fluorescent proteins (IFPs) based on the chromophore-binding domain of the Deinococcus radiodurans bacteriophytochrome. Our study suggests that the experimentally observed enhancement of fluorescent properties results from the improved rigidity and planarity of the biliverdin chromophore, in particular of the first two pyrrole rings neighboring the covalent linkage to the protein. We propose that the increases in the levels of both motion and bending of the chromophore out of planarity favor the decrease in fluorescence. The chromophore-binding pocket in some of the studied proteins, in particular the weakly fluorescent parent protein, is shown to be readily accessible to water molecules from the solvent. These waters entering the chromophore region form hydrogen bond networks that affect the otherwise planar conformation of the first three rings of the chromophore. On the basis of our simulations, the enhancement of fluorescence in IFPs can be achieved either by reducing the mobility of water molecules in the vicinity of the chromophore or by limiting the interactions of the nearby protein residues with the chromophore. Finally, simulations performed at both low and neutral pH values highlight differences in the dynamics of the chromophore and shed light on the mechanism of fluorescence loss at low pH.


  • Organizational Affiliation

    Université Grenoble Alpes , Institut de Biologie Structurale (IBS), F-38044 Grenoble, France.


Macromolecules
Find similar proteins by:  (by identity cutoff)  |  3D Structure
Entity ID: 1
MoleculeChains Sequence LengthOrganismDetailsImage
BACTERIOPHYTOCHROME329Deinococcus radioduransMutation(s): 13 
EC: 2.7.13.3
UniProt
Find proteins for Q9RZA4 (Deinococcus radiodurans (strain ATCC 13939 / DSM 20539 / JCM 16871 / CCUG 27074 / LMG 4051 / NBRC 15346 / NCIMB 9279 / VKM B-1422 / R1))
Explore Q9RZA4 
Go to UniProtKB:  Q9RZA4
Entity Groups  
Sequence Clusters30% Identity50% Identity70% Identity90% Identity95% Identity100% Identity
UniProt GroupQ9RZA4
Sequence Annotations
Expand
  • Reference Sequence
Small Molecules
Ligands 1 Unique
IDChains Name / Formula / InChI Key2D Diagram3D Interactions
LBV
Query on LBV

Download Ideal Coordinates CCD File 
B [auth A]3-[2-[(Z)-[3-(2-carboxyethyl)-5-[(Z)-(4-ethenyl-3-methyl-5-oxidanylidene-pyrrol-2-ylidene)methyl]-4-methyl-pyrrol-1-ium -2-ylidene]methyl]-5-[(Z)-[(3E)-3-ethylidene-4-methyl-5-oxidanylidene-pyrrolidin-2-ylidene]methyl]-4-methyl-1H-pyrrol-3- yl]propanoic acid
C33 H37 N4 O6
DKMLMZVDTGOEGU-ISEYCTJISA-O
Experimental Data & Validation

Experimental Data

  • Method: X-RAY DIFFRACTION
  • Resolution: 1.11 Å
  • R-Value Free: 0.168 
  • R-Value Work: 0.146 
  • R-Value Observed: 0.147 
  • Space Group: C 1 2 1
Unit Cell:
Length ( Å )Angle ( ˚ )
a = 95.361α = 90
b = 53.028β = 90.9
c = 66.219γ = 90
Software Package:
Software NamePurpose
REFMACrefinement
XDSdata reduction
XSCALEdata scaling
PHASERphasing

Structure Validation

View Full Validation Report


Ligand Structure Quality Assessment 


Entry History 

Deposition Data

Revision History  (Full details and data files)

  • Version 1.0: 2016-03-09
    Type: Initial release
  • Version 1.1: 2016-08-10
    Changes: Database references
  • Version 1.2: 2016-08-17
    Changes: Structure summary
  • Version 1.3: 2016-08-24
    Changes: Database references
  • Version 1.4: 2024-01-10
    Changes: Data collection, Database references, Derived calculations, Other, Refinement description, Structure summary