4QOK

Structural basis for ineffective T-cell responses to MHC anchor residue improved heteroclitic peptides


Experimental Data Snapshot

  • Method: X-RAY DIFFRACTION
  • Resolution: 3.00 Å
  • R-Value Free: 0.262 
  • R-Value Work: 0.203 
  • R-Value Observed: 0.206 

wwPDB Validation   3D Report Full Report


This is version 1.3 of the entry. See complete history


Literature

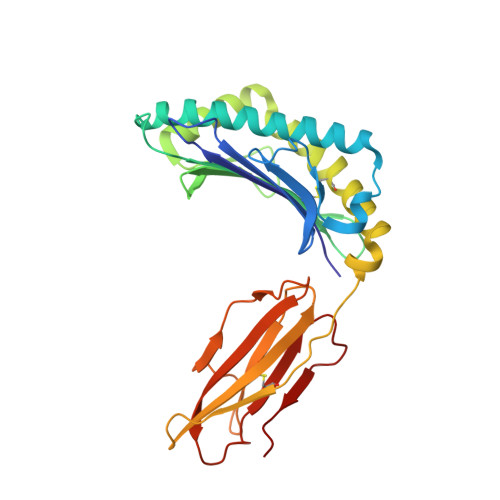
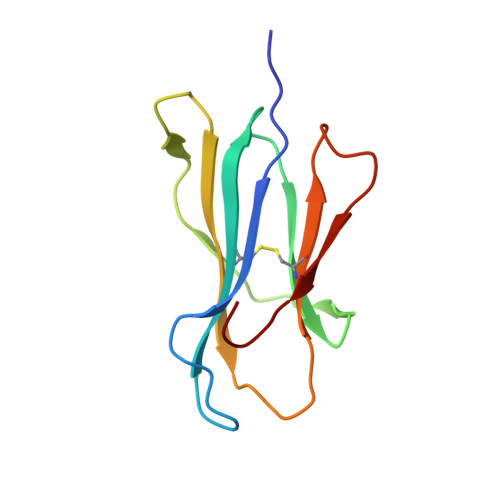
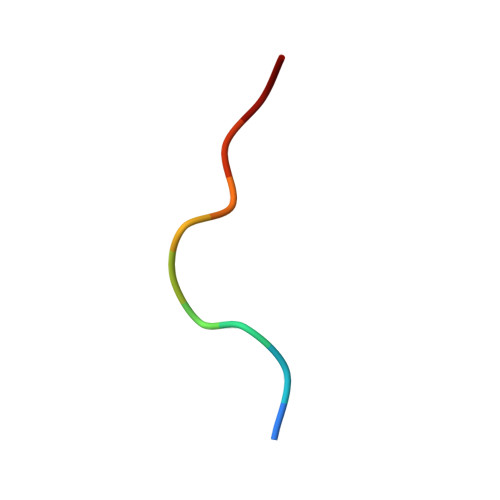
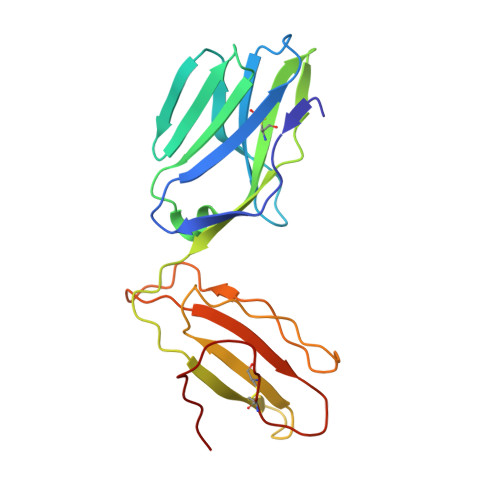
Structural basis for ineffective T-cell responses to MHC anchor residue-improved "heteroclitic" peptides.

Madura, F.Rizkallah, P.J.Holland, C.J.Fuller, A.Bulek, A.Godkin, A.J.Schauenburg, A.J.Cole, D.K.Sewell, A.K.

(2015) Eur J Immunol 45: 584-591

  • DOI: https://doi.org/10.1002/eji.201445114
  • Primary Citation of Related Structures:  
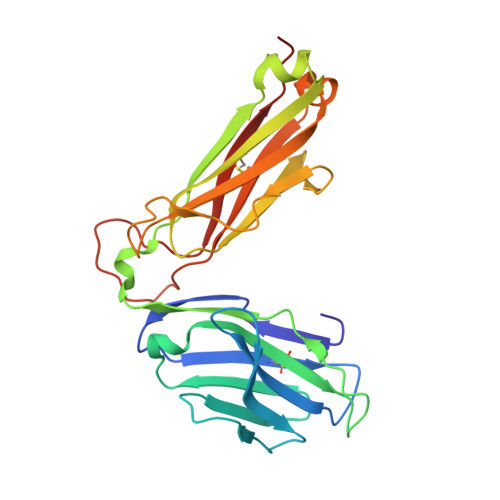
    4QOK

  • PubMed Abstract: 

    MHC anchor residue-modified "heteroclitic" peptides have been used in many cancer vaccine trials and often induce greater immune responses than the wild-type peptide. The best-studied system to date is the decamer MART-1/Melan-A26-35 peptide, EAAGIGILTV, where the natural alanine at position 2 has been modified to leucine to improve human leukocyte antigen (HLA)-A*0201 anchoring. The resulting ELAGIGILTV peptide has been used in many studies. We recently showed that T cells primed with the ELAGIGILTV peptide can fail to recognize the natural tumor-expressed peptide efficiently, thereby providing a potential molecular reason for why clinical trials of this peptide have been unsuccessful. Here, we solved the structure of a TCR in complex with HLA-A*0201-EAAGIGILTV peptide and compared it with its heteroclitic counterpart , HLA-A*0201-ELAGIGILTV. The data demonstrate that a suboptimal anchor residue at position 2 enables the TCR to "pull" the peptide away from the MHC binding groove, facilitating extra contacts with both the peptide and MHC surface. These data explain how a TCR can distinguish between two epitopes that differ by only a single MHC anchor residue and demonstrate how weak MHC anchoring can enable an induced-fit interaction with the TCR. Our findings constitute a novel demonstration of the extreme sensitivity of the TCR to minor alterations in peptide conformation.


  • Organizational Affiliation

    Division of Infection and Immunity, Cardiff University School of Medicine, Heath Park, Cardiff, UK.


Macromolecules
Find similar proteins by:  (by identity cutoff)  |  3D Structure
Entity ID: 1
MoleculeChains Sequence LengthOrganismDetailsImage
HLA class I histocompatibility antigen, A-2 alpha chain276Homo sapiensMutation(s): 0 
Gene Names: HLA-AHLAA
UniProt & NIH Common Fund Data Resources
Find proteins for P04439 (Homo sapiens)
Explore P04439 
Go to UniProtKB:  P04439
PHAROS:  P04439
GTEx:  ENSG00000206503 
Entity Groups  
Sequence Clusters30% Identity50% Identity70% Identity90% Identity95% Identity100% Identity
UniProt GroupP04439
Sequence Annotations
Expand
  • Reference Sequence
Find similar proteins by:  (by identity cutoff)  |  3D Structure
Entity ID: 2
MoleculeChains Sequence LengthOrganismDetailsImage
Beta-2-microglobulin100Homo sapiensMutation(s): 0 
Gene Names: B2MCDABP0092HDCMA22P
UniProt & NIH Common Fund Data Resources
Find proteins for P61769 (Homo sapiens)
Explore P61769 
Go to UniProtKB:  P61769
PHAROS:  P61769
GTEx:  ENSG00000166710 
Entity Groups  
Sequence Clusters30% Identity50% Identity70% Identity90% Identity95% Identity100% Identity
UniProt GroupP61769
Sequence Annotations
Expand
  • Reference Sequence

Find similar proteins by:  Sequence   |   3D Structure  

Entity ID: 3
MoleculeChains Sequence LengthOrganismDetailsImage
Melanoma antigen recognized by T-cells 1 marker peptide10Homo sapiensMutation(s): 0 
UniProt & NIH Common Fund Data Resources
Find proteins for Q16655 (Homo sapiens)
Explore Q16655 
Go to UniProtKB:  Q16655
PHAROS:  Q16655
GTEx:  ENSG00000120215 
Entity Groups  
Sequence Clusters30% Identity50% Identity70% Identity90% Identity95% Identity100% Identity
UniProt GroupQ16655
Sequence Annotations
Expand
  • Reference Sequence
Find similar proteins by:  (by identity cutoff)  |  3D Structure
Entity ID: 4
MoleculeChains Sequence LengthOrganismDetailsImage
Mel5 TCR chain alpha194Homo sapiensMutation(s): 0 
Entity Groups  
Sequence Clusters30% Identity50% Identity70% Identity90% Identity95% Identity100% Identity
Sequence Annotations
Expand
  • Reference Sequence
Find similar proteins by:  (by identity cutoff)  |  3D Structure
Entity ID: 5
MoleculeChains Sequence LengthOrganismDetailsImage
Mel5 TCR chain beta244Homo sapiensMutation(s): 0 
Entity Groups  
Sequence Clusters30% Identity50% Identity70% Identity90% Identity95% Identity100% Identity
Sequence Annotations
Expand
  • Reference Sequence
Experimental Data & Validation

Experimental Data

  • Method: X-RAY DIFFRACTION
  • Resolution: 3.00 Å
  • R-Value Free: 0.262 
  • R-Value Work: 0.203 
  • R-Value Observed: 0.206 
  • Space Group: P 43
Unit Cell:
Length ( Å )Angle ( ˚ )
a = 120.69α = 90
b = 120.69β = 90
c = 82.06γ = 90
Software Package:
Software NamePurpose
SCALAdata scaling
PHASERphasing
REFMACrefinement
PDB_EXTRACTdata extraction
GDAdata collection

Structure Validation

View Full Validation Report


Entry History 

Deposition Data

Revision History  (Full details and data files)

  • Version 1.0: 2014-12-17
    Type: Initial release
  • Version 1.1: 2015-02-25
    Changes: Database references
  • Version 1.2: 2017-11-22
    Changes: Refinement description
  • Version 1.3: 2023-09-20
    Changes: Data collection, Database references, Derived calculations, Refinement description