4OYR

Competition of the small inhibitor PT91 with large fatty acyl substrate of the Mycobacterium tuberculosis enoyl-ACP reductase InhA by induced substrate-binding loop refolding


Experimental Data Snapshot

  • Method: X-RAY DIFFRACTION
  • Resolution: 2.30 Å
  • R-Value Free: 0.244 
  • R-Value Work: 0.194 
  • R-Value Observed: 0.197 

wwPDB Validation   3D Report Full Report


Ligand Structure Quality Assessment 


This is version 1.3 of the entry. See complete history


Literature

A Structural and Energetic Model for the Slow-Onset Inhibition of the Mycobacterium tuberculosis Enoyl-ACP Reductase InhA.

Li, H.J.Lai, C.T.Pan, P.Yu, W.Liu, N.Bommineni, G.R.Garcia-Diaz, M.Simmerling, C.Tonge, P.J.

(2014) ACS Chem Biol 9: 986-993

  • DOI: https://doi.org/10.1021/cb400896g
  • Primary Citation of Related Structures:  
    4OHU, 4OXK, 4OXN, 4OXY, 4OYR

  • PubMed Abstract: 

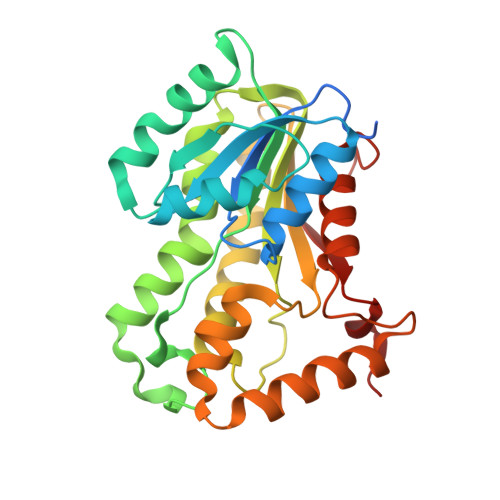
    Slow-onset enzyme inhibitors are of great interest for drug discovery programs since the slow dissociation of the inhibitor from the drug-target complex results in sustained target occupancy leading to improved pharmacodynamics. However, the structural basis for slow-onset inhibition is often not fully understood, hindering the development of structure-kinetic relationships and the rational optimization of drug-target residence time. Previously we demonstrated that slow-onset inhibition of the Mycobacterium tuberculosis enoyl-ACP reductase InhA correlated with motions of a substrate-binding loop (SBL) near the active site. In the present work, X-ray crystallography and molecular dynamics simulations have been used to map the structural and energetic changes of the SBL that occur upon enzyme inhibition. Helix-6 within the SBL adopts an open conformation when the inhibitor structure or binding kinetics is substrate-like. In contrast, slow-onset inhibition results in large-scale local refolding in which helix-6 adopts a closed conformation not normally populated during substrate turnover. The open and closed conformations of helix-6 are hypothesized to represent the EI and EI* states on the two-step induced-fit reaction coordinate for enzyme inhibition. These two states were used as the end points for nudged elastic band molecular dynamics simulations resulting in two-dimensional potential energy profiles that reveal the barrier between EI and EI*, thus rationalizing the binding kinetics observed with different inhibitors. Our findings indicate that the structural basis for slow-onset kinetics can be understood once the structures of both EI and EI* have been identified, thus providing a starting point for the rational control of enzyme-inhibitor binding kinetics.


  • Organizational Affiliation

    Institute for Chemical Biology and Drug Discovery, ‡Laufer Center for Physical and Quantitative Biology and §Department of Chemistry, ∥Graduate Program in Biochemistry and Structural Biology, and ⊥Department of Pharmacological Sciences, Stony Brook University , Stony Brook, New York 11794, United States.


Macromolecules
Find similar proteins by:  (by identity cutoff)  |  3D Structure
Entity ID: 1
MoleculeChains Sequence LengthOrganismDetailsImage
Enoyl-[acyl-carrier-protein] reductase [NADH]
A, B, C, D
289Mycobacterium tuberculosisMutation(s): 0 
Gene Names: MT1531MTCY277.05Rv1484inhA
EC: 1.3.1.9
UniProt
Find proteins for P9WGR1 (Mycobacterium tuberculosis (strain ATCC 25618 / H37Rv))
Explore P9WGR1 
Go to UniProtKB:  P9WGR1
Entity Groups  
Sequence Clusters30% Identity50% Identity70% Identity90% Identity95% Identity100% Identity
UniProt GroupP9WGR1
Sequence Annotations
Expand
  • Reference Sequence
Small Molecules
Binding Affinity Annotations 
IDSourceBinding Affinity
1US Binding MOAD:  4OYR Ki: 0.96 (nM) from 1 assay(s)
BindingDB:  4OYR Ki: 0.96 (nM) from 1 assay(s)
IC50: 49 (nM) from 1 assay(s)
Experimental Data & Validation

Experimental Data

  • Method: X-RAY DIFFRACTION
  • Resolution: 2.30 Å
  • R-Value Free: 0.244 
  • R-Value Work: 0.194 
  • R-Value Observed: 0.197 
  • Space Group: P 21 21 21
Unit Cell:
Length ( Å )Angle ( ˚ )
a = 74.842α = 90
b = 90.653β = 90
c = 164.436γ = 90
Software Package:
Software NamePurpose
HKL-2000data collection
HKL-2000data scaling
PHENIXrefinement
PDB_EXTRACTdata extraction
CNSrefinement
MOLREPphasing

Structure Validation

View Full Validation Report


Ligand Structure Quality Assessment 


Entry History & Funding Information

Deposition Data


Funding OrganizationLocationGrant Number
National Institutes of Health/National Institute of General Medical Sciences (NIH/NIGMS)United StatesGM102864
Department of Energy (DOE, United States)United States--
National Institutes of Health/National Center for Research Resources (NIH/NCRR)United StatesP41RR012408

Revision History  (Full details and data files)

  • Version 1.0: 2014-04-30
    Type: Initial release
  • Version 1.1: 2017-09-06
    Changes: Advisory, Author supporting evidence, Derived calculations, Other, Refinement description, Source and taxonomy, Structure summary
  • Version 1.2: 2019-12-04
    Changes: Author supporting evidence
  • Version 1.3: 2023-09-27
    Changes: Data collection, Database references, Refinement description