4K9J

Structure of Re(CO)3(4,7-dimethyl-phen)(Thr126His)(Lys122Trp)(His83Glu)(Trp48Phe)(Tyr72Phe)(Tyr108Phe)AzCu(II), a Rhenium modified Azurin mutant


Experimental Data Snapshot

  • Method: X-RAY DIFFRACTION
  • Resolution: 1.70 Å
  • R-Value Free: 0.236 
  • R-Value Work: 0.196 
  • R-Value Observed: 0.198 

wwPDB Validation   3D Report Full Report


Ligand Structure Quality Assessment 


This is version 1.3 of the entry. See complete history


Literature

Tryptophan-accelerated electron flow across a protein-protein interface.

Takematsu, K.Williamson, H.Blanco-Rodriguez, A.M.Sokolova, L.Nikolovski, P.Kaiser, J.T.Towrie, M.Clark, I.P.Vlcek, A.Winkler, J.R.Gray, H.B.

(2013) J Am Chem Soc 135: 15515-15525

  • DOI: https://doi.org/10.1021/ja406830d
  • Primary Citation of Related Structures:  
    4K9J

  • PubMed Abstract: 

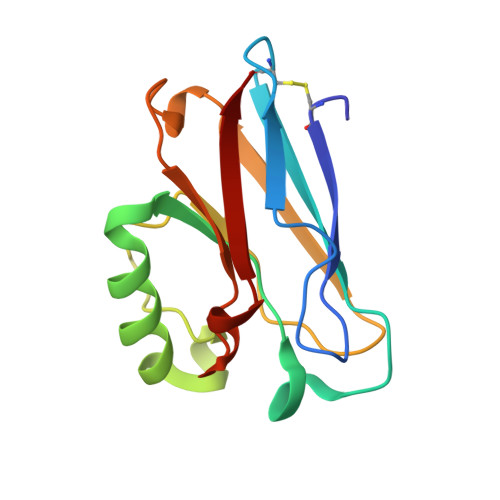
    We report a new metallolabeled blue copper protein, Re126W122Cu(I) Pseudomonas aeruginosa azurin, which has three redox sites at well-defined distances in the protein fold: Re(I)(CO)3(4,7-dimethyl-1,10-phenanthroline) covalently bound at H126, a Cu center, and an indole side chain W122 situated between the Re and Cu sites (Re-W122(indole) = 13.1 Å, dmp-W122(indole) = 10.0 Å, Re-Cu = 25.6 Å). Near-UV excitation of the Re chromophore leads to prompt Cu(I) oxidation (<50 ns), followed by slow back ET to regenerate Cu(I) and ground-state Re(I) with biexponential kinetics, 220 ns and 6 μs. From spectroscopic measurements of kinetics and relative ET yields at different concentrations, it is likely that the photoinduced ET reactions occur in protein dimers, (Re126W122Cu(I))2 and that the forward ET is accelerated by intermolecular electron hopping through the interfacial tryptophan: *Re//←W122←Cu(I), where // denotes a protein-protein interface. Solution mass spectrometry confirms a broad oligomer distribution with prevalent monomers and dimers, and the crystal structure of the Cu(II) form shows two Re126W122Cu(II) molecules oriented such that redox cofactors Re(dmp) and W122-indole on different protein molecules are located at the interface at much shorter intermolecular distances (Re-W122(indole) = 6.9 Å, dmp-W122(indole) = 3.5 Å, and Re-Cu = 14.0 Å) than within single protein folds. Whereas forward ET is accelerated by hopping through W122, BET is retarded by a space jump at the interface that lacks specific interactions or water molecules. These findings on interfacial electron hopping in (Re126W122Cu(I))2 shed new light on optimal redox-unit placements required for functional long-range charge separation in protein complexes.


  • Organizational Affiliation

    Beckman Institute, California Institute of Technology , Pasadena, California 91125, United States.


Macromolecules
Find similar proteins by:  (by identity cutoff)  |  3D Structure
Entity ID: 1
MoleculeChains Sequence LengthOrganismDetailsImage
Azurin128Pseudomonas aeruginosa PAO1Mutation(s): 6 
Gene Names: azuPA4922
UniProt
Find proteins for P00282 (Pseudomonas aeruginosa (strain ATCC 15692 / DSM 22644 / CIP 104116 / JCM 14847 / LMG 12228 / 1C / PRS 101 / PAO1))
Explore P00282 
Go to UniProtKB:  P00282
Entity Groups  
Sequence Clusters30% Identity50% Identity70% Identity90% Identity95% Identity100% Identity
UniProt GroupP00282
Sequence Annotations
Expand
  • Reference Sequence
Small Molecules
Ligands 2 Unique
IDChains Name / Formula / InChI Key2D Diagram3D Interactions
REQ
Query on REQ

Download Ideal Coordinates CCD File 
C [auth A](1,10 PHENANTHROLINE)-(TRI-CARBON MONOXIDE) RHENIUM (I)
C17 H12 N2 O3 Re
SINYNGNXCUIFTB-UHFFFAOYSA-N
CU
Query on CU

Download Ideal Coordinates CCD File 
B [auth A]COPPER (II) ION
Cu
JPVYNHNXODAKFH-UHFFFAOYSA-N
Experimental Data & Validation

Experimental Data

  • Method: X-RAY DIFFRACTION
  • Resolution: 1.70 Å
  • R-Value Free: 0.236 
  • R-Value Work: 0.196 
  • R-Value Observed: 0.198 
  • Space Group: F 2 2 2
Unit Cell:
Length ( Å )Angle ( ˚ )
a = 42.391α = 90
b = 93.215β = 90
c = 109.383γ = 90
Software Package:
Software NamePurpose
Blu-Icedata collection
PHASERphasing
PHENIXrefinement
XDSdata reduction
SCALAdata scaling

Structure Validation

View Full Validation Report


Ligand Structure Quality Assessment 


Entry History 

Revision History  (Full details and data files)

  • Version 1.0: 2013-10-02
    Type: Initial release
  • Version 1.1: 2014-02-05
    Changes: Database references
  • Version 1.2: 2023-09-20
    Changes: Data collection, Database references, Derived calculations, Refinement description
  • Version 1.3: 2024-03-13
    Changes: Source and taxonomy, Structure summary