


4DEP
Structure of the IL-1b signaling complex
- PDB DOI: https://doi.org/10.2210/pdb4DEP/pdb
- Classification: IMMUNE SYSTEM
- Organism(s): Homo sapiens
- Expression System: Escherichia coli, Homo sapiens
- Mutation(s): No
- Deposited: 2012-01-21 Released: 2012-03-21
Experimental Data Snapshot
- Method: X-RAY DIFFRACTION
- Resolution: 3.10 Å
- R-Value Free: 0.277
- R-Value Work: 0.210
- R-Value Observed: 0.213

This is version 1.2 of the entry. See complete history.

Macromolecules
Find similar proteins by:
(by identity cutoff) | 3D Structure
Entity ID: 1 | |||||
|---|---|---|---|---|---|
| Molecule | Chains | Sequence Length | Organism | Details | Image |
| Interleukin-1 beta | 158 | Homo sapiens | Mutation(s): 0 Gene Names: IL-1b, IL1B, IL1F2 | 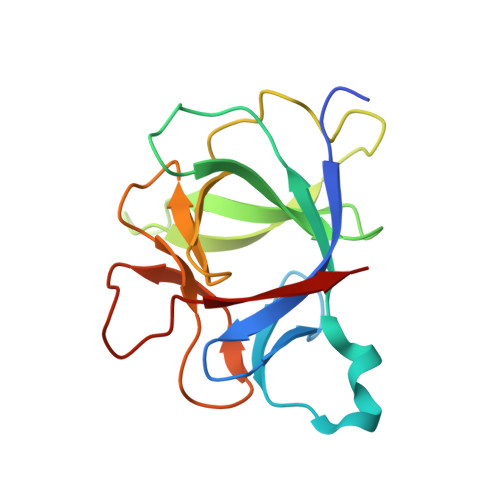 | |
UniProt & NIH Common Fund Data Resources | |||||
Find proteins for P01584 (Homo sapiens) Explore P01584 Go to UniProtKB: P01584 | |||||
PHAROS: P01584 GTEx: ENSG00000125538 | |||||
Entity Groups | |||||
| Sequence Clusters | 30% Identity50% Identity70% Identity90% Identity95% Identity100% Identity | ||||
| UniProt Group | P01584 | ||||
Sequence AnnotationsExpand | |||||
| |||||
Find similar proteins by:
(by identity cutoff) | 3D Structure
Entity ID: 2 | |||||
|---|---|---|---|---|---|
| Molecule | Chains | Sequence Length | Organism | Details | Image |
| Interleukin-1 receptor type 1 | 321 | Homo sapiens | Mutation(s): 0 Gene Names: IL-1RI, IL1R, IL1R1, IL1RA, IL1RT1 | 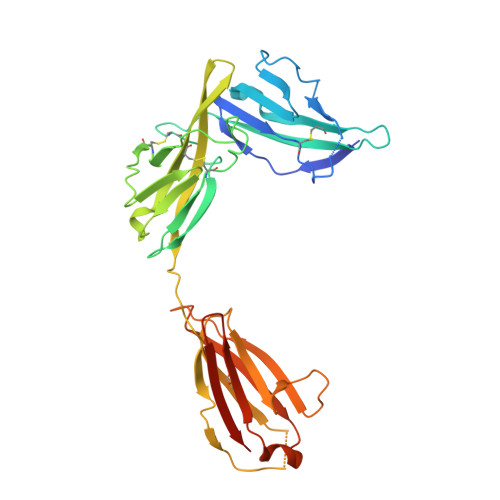 | |
UniProt & NIH Common Fund Data Resources | |||||
Find proteins for P14778 (Homo sapiens) Explore P14778 Go to UniProtKB: P14778 | |||||
PHAROS: P14778 GTEx: ENSG00000115594 | |||||
Entity Groups | |||||
| Sequence Clusters | 30% Identity50% Identity70% Identity90% Identity95% Identity100% Identity | ||||
| UniProt Group | P14778 | ||||
Sequence AnnotationsExpand | |||||
| |||||
Find similar proteins by:
(by identity cutoff) | 3D Structure
Entity ID: 3 | |||||
|---|---|---|---|---|---|
| Molecule | Chains | Sequence Length | Organism | Details | Image |
| Interleukin-1 receptor accessory protein | 349 | Homo sapiens | Mutation(s): 0 Gene Names: C3orf13, IL-1RAcP, IL1R3, IL1RAP | 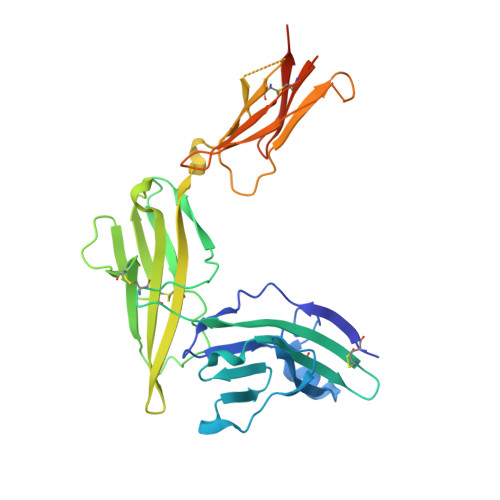 | |
UniProt & NIH Common Fund Data Resources | |||||
Find proteins for Q9NPH3 (Homo sapiens) Explore Q9NPH3 Go to UniProtKB: Q9NPH3 | |||||
PHAROS: Q9NPH3 GTEx: ENSG00000196083 | |||||
Entity Groups | |||||
| Sequence Clusters | 30% Identity50% Identity70% Identity90% Identity95% Identity100% Identity | ||||
| UniProt Group | Q9NPH3 | ||||
Sequence AnnotationsExpand | |||||
| |||||
Small Molecules
| Ligands 1 Unique | |||||
|---|---|---|---|---|---|
| ID | Chains | Name / Formula / InChI Key | 2D Diagram | 3D Interactions | |
| NAG Query on NAG | G [auth B] H [auth B] I [auth B] J [auth C] K [auth C] | 2-acetamido-2-deoxy-beta-D-glucopyranose C8 H15 N O6 OVRNDRQMDRJTHS-FMDGEEDCSA-N |  | ||
Experimental Data & Validation
Experimental Data
- Method: X-RAY DIFFRACTION
- Resolution: 3.10 Å
- R-Value Free: 0.277
- R-Value Work: 0.210
- R-Value Observed: 0.213
- Space Group: P 1 21 1
Unit Cell:
| Length ( Å ) | Angle ( ˚ ) |
|---|---|
| a = 105.99 | α = 90 |
| b = 65.9 | β = 90.35 |
| c = 163.4 | γ = 90 |
| Software Name | Purpose |
|---|---|
| Blu-Ice | data collection |
| PHASER | phasing |
| PHENIX | refinement |
| XDS | data reduction |
| XSCALE | data scaling |
Entry History
Deposition Data
- Released Date: 2012-03-21 Deposition Author(s): Thomas, C., Garcia, K.C.
Revision History (Full details and data files)
- Version 1.0: 2012-03-21
Type: Initial release - Version 1.1: 2012-04-18
Changes: Database references - Version 1.2: 2020-07-29
Type: Remediation
Reason: Carbohydrate remediation
Changes: Data collection, Database references, Derived calculations, Structure summary
