4J2Y

Crystal structure of a plant trypsin inhibitor EcTI in complex with bovine trypsin.


Experimental Data Snapshot

  • Method: X-RAY DIFFRACTION
  • Resolution: 2.00 Å
  • R-Value Free: 0.258 
  • R-Value Work: 0.196 
  • R-Value Observed: 0.198 

wwPDB Validation   3D Report Full Report


This is version 2.1 of the entry. See complete history


Literature

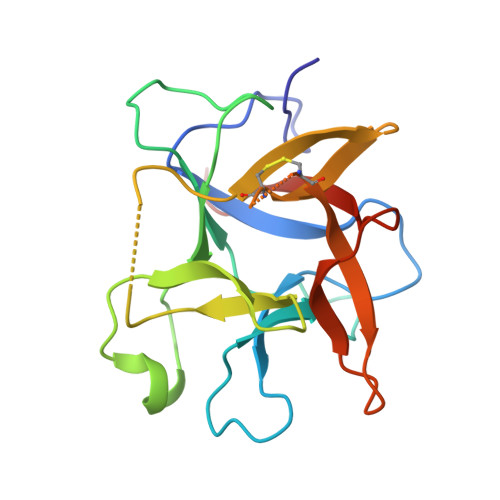
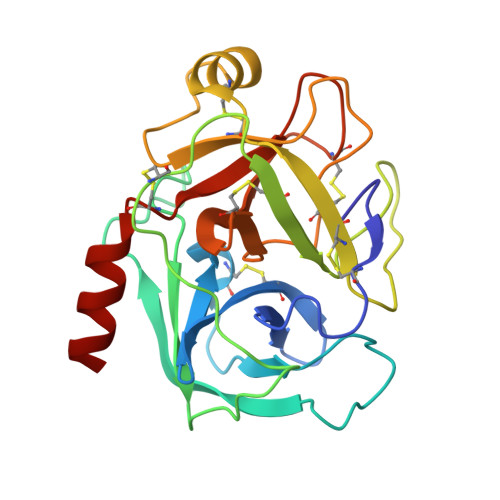
Crystal Structures of a Plant Trypsin Inhibitor from Enterolobium contortisiliquum (EcTI) and of Its Complex with Bovine Trypsin.

Zhou, D.Lobo, Y.A.Batista, I.F.Marques-Porto, R.Gustchina, A.Oliva, M.L.Wlodawer, A.

(2013) PLoS One 8: e62252-e62252

  • DOI: https://doi.org/10.1371/journal.pone.0062252
  • Primary Citation of Related Structures:  
    4J2K, 4J2Y

  • PubMed Abstract: 

    A serine protease inhibitor from Enterolobium contortisiliquum (EcTI) belongs to the Kunitz family of plant inhibitors, common in plant seeds. It was shown that EcTI inhibits the invasion of gastric cancer cells through alterations in integrin-dependent cell signaling pathway. We determined high-resolution crystal structures of free EcTI (at 1.75 Å) and complexed with bovine trypsin (at 2 Å). High quality of the resulting electron density maps and the redundancy of structural information indicated that the sequence of the crystallized isoform contained 176 residues and differed from the one published previously. The structure of the complex confirmed the standard inhibitory mechanism in which the reactive loop of the inhibitor is docked into trypsin active site with the side chains of Arg64 and Ile65 occupying the S1 and S1' pockets, respectively. The overall conformation of the reactive loop undergoes only minor adjustments upon binding to trypsin. Larger deviations are seen in the vicinity of Arg64, driven by the needs to satisfy specificity requirements. A comparison of the EcTI-trypsin complex with the complexes of related Kunitz inhibitors has shown that rigid body rotation of the inhibitors by as much as 15° is required for accurate juxtaposition of the reactive loop with the active site while preserving its conformation. Modeling of the putative complexes of EcTI with several serine proteases and a comparison with equivalent models for other Kunitz inhibitors elucidated the structural basis for the fine differences in their specificity, providing tools that might allow modification of their potency towards the individual enzymes.


  • Organizational Affiliation

    Macromolecular Crystallography Laboratory, Center for Cancer Research, National Cancer Institute, Frederick, Maryland, United States of America.


Macromolecules
Find similar proteins by:  (by identity cutoff)  |  3D Structure
Entity ID: 1
MoleculeChains Sequence LengthOrganismDetailsImage
Trypsin inhibitor176Enterolobium contortisiliquumMutation(s): 0 
UniProt
Find proteins for P86451 (Enterolobium contortisiliquum)
Explore P86451 
Go to UniProtKB:  P86451
Entity Groups  
Sequence Clusters30% Identity50% Identity70% Identity90% Identity95% Identity100% Identity
UniProt GroupP86451
Sequence Annotations
Expand
  • Reference Sequence
Find similar proteins by:  (by identity cutoff)  |  3D Structure
Entity ID: 2
MoleculeChains Sequence LengthOrganismDetailsImage
Cationic trypsin223Bos taurusMutation(s): 0 
EC: 3.4.21.4
UniProt
Find proteins for P00760 (Bos taurus)
Explore P00760 
Go to UniProtKB:  P00760
Entity Groups  
Sequence Clusters30% Identity50% Identity70% Identity90% Identity95% Identity100% Identity
UniProt GroupP00760
Sequence Annotations
Expand
  • Reference Sequence
Small Molecules
Ligands 1 Unique
IDChains Name / Formula / InChI Key2D Diagram3D Interactions
SO4
Query on SO4

Download Ideal Coordinates CCD File 
C [auth A]SULFATE ION
O4 S
QAOWNCQODCNURD-UHFFFAOYSA-L
Experimental Data & Validation

Experimental Data

  • Method: X-RAY DIFFRACTION
  • Resolution: 2.00 Å
  • R-Value Free: 0.258 
  • R-Value Work: 0.196 
  • R-Value Observed: 0.198 
  • Space Group: C 1 2 1
Unit Cell:
Length ( Å )Angle ( ˚ )
a = 73.26α = 90
b = 38.582β = 104.19
c = 122.817γ = 90
Software Package:
Software NamePurpose
MAR345dtbdata collection
PHASESphasing
PHENIXrefinement
XDSdata reduction
XDSdata scaling

Structure Validation

View Full Validation Report


Entry History 

Deposition Data

Revision History  (Full details and data files)

  • Version 1.0: 2013-05-08
    Type: Initial release
  • Version 2.0: 2019-02-06
    Changes: Data collection, Database references, Non-polymer description, Refinement description, Source and taxonomy, Structure summary
  • Version 2.1: 2023-09-20
    Changes: Data collection, Database references, Derived calculations, Refinement description