


Crystallographic structure analysis of family 18 Chitinase from Crocus vernus
Akrem, A., Iqbal, S., Buck, F., Negm, A., Perbandt, M., Betzel, C.To be published.
Experimental Data Snapshot
wwPDB Validation 3D Report Full Report

Entity ID: 1 | |||||
|---|---|---|---|---|---|
| Molecule | Chains | Sequence Length | Organism | Details | Image |
| Protein, Family 18 Chitinase | 275 | Crocus vernus | Mutation(s): 0 | 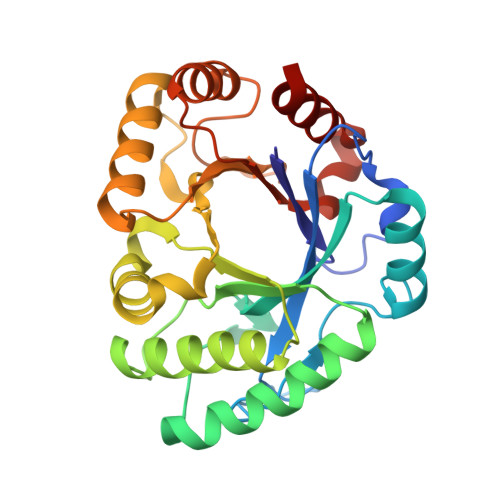 | |
UniProt | |||||
Find proteins for G1K3S3 (Crocus vernus) Explore G1K3S3 Go to UniProtKB: G1K3S3 | |||||
Entity Groups | |||||
| Sequence Clusters | 30% Identity50% Identity70% Identity90% Identity95% Identity100% Identity | ||||
| UniProt Group | G1K3S3 | ||||
Sequence AnnotationsExpand | |||||
| |||||
| Ligands 2 Unique | |||||
|---|---|---|---|---|---|
| ID | Chains | Name / Formula / InChI Key | 2D Diagram | 3D Interactions | |
| GOL Query on GOL | D [auth A], E [auth B] | GLYCEROL C3 H8 O3 PEDCQBHIVMGVHV-UHFFFAOYSA-N |  | ||
| ACT Query on ACT | C [auth A] | ACETATE ION C2 H3 O2 QTBSBXVTEAMEQO-UHFFFAOYSA-M |  | ||
| Length ( Å ) | Angle ( ˚ ) |
|---|---|
| a = 172.27 | α = 90 |
| b = 37.08 | β = 127.01 |
| c = 126.37 | γ = 90 |
| Software Name | Purpose |
|---|---|
| DNA | data collection |
| REFMAC | refinement |
| MOSFLM | data reduction |
| SCALA | data scaling |
RCSB PDB (citation) is hosted by
RCSB PDB is a member of the

