


Crystal structure of thiazole synthase Thi4 from Neurospora crassa
Kang, Y.N., Bale, S., Begley, T.P., Ealick, S.E.To be published.
Experimental Data Snapshot
Entity ID: 1 | |||||
|---|---|---|---|---|---|
| Molecule | Chains | Sequence Length | Organism | Details | Image |
| CyPBP37 protein | 344 | Neurospora crassa | Mutation(s): 1 Gene Names: NCU06110, NCU06110.1 | 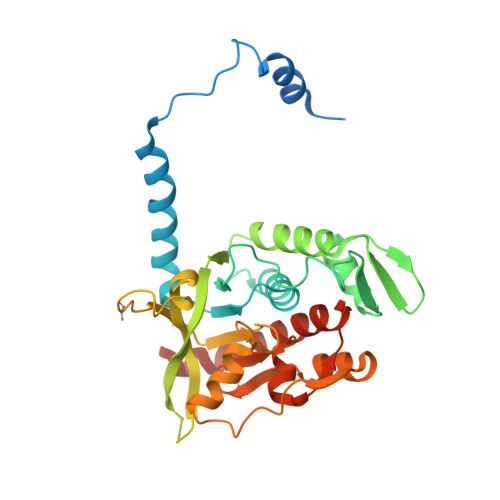 | |
UniProt | |||||
Find proteins for Q1K6I4 (Neurospora crassa (strain ATCC 24698 / 74-OR23-1A / CBS 708.71 / DSM 1257 / FGSC 987)) Explore Q1K6I4 Go to UniProtKB: Q1K6I4 | |||||
Entity Groups | |||||
| Sequence Clusters | 30% Identity50% Identity70% Identity90% Identity95% Identity100% Identity | ||||
| UniProt Group | Q1K6I4 | ||||
Sequence AnnotationsExpand | |||||
| |||||
| Ligands 2 Unique | |||||
|---|---|---|---|---|---|
| ID | Chains | Name / Formula / InChI Key | 2D Diagram | 3D Interactions | |
| AHZ Query on AHZ | AA [auth F] CA [auth G] EA [auth H] GA [auth I] IA [auth J] | ADENOSINE DIPHOSPHATE 5-(BETA-ETHYL)-4-METHYL-THIAZOLE-2-CARBOXYLIC ACID C17 H19 N6 O12 P2 S VGXBGQACJQRWLV-LKGUXBDMSA-K |  | ||
| FE2 Query on FE2 | BA [auth F] DA [auth G] FA [auth H] HA [auth I] JA [auth J] | FE (II) ION Fe CWYNVVGOOAEACU-UHFFFAOYSA-N |  | ||
| Modified Residues 1 Unique | |||||
|---|---|---|---|---|---|
| ID | Chains | Type | Formula | 2D Diagram | Parent |
| DHA Query on DHA | A, B, C, D, E A, B, C, D, E, F, G, H, I, J, K, L, M, N, O, P | PEPTIDE LINKING | C3 H5 N O2 |  | SER |
| Length ( Å ) | Angle ( ˚ ) |
|---|---|
| a = 158.237 | α = 90 |
| b = 125.914 | β = 90.22 |
| c = 158.208 | γ = 90 |
| Software Name | Purpose |
|---|---|
| DENZO | data reduction |
| SCALEPACK | data scaling |
| CNS | refinement |
| PDB_EXTRACT | data extraction |
| ADSC | data collection |
| HKL-2000 | data reduction |
| HKL-2000 | data scaling |
| CNS | phasing |
RCSB PDB (citation) is hosted by
RCSB PDB is a member of the

