3F9R

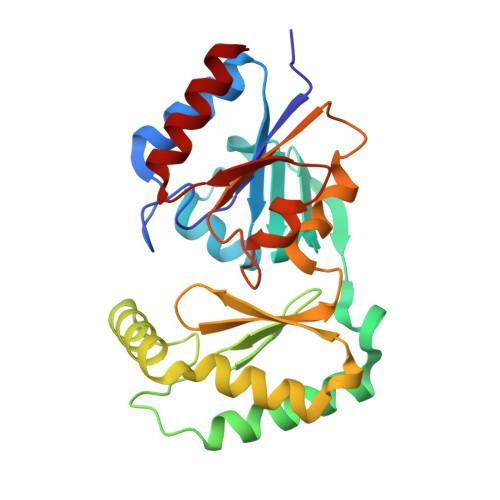
Crystal Structure of Trypanosoma Brucei phosphomannosemutase, TB.10.700.370


Experimental Data Snapshot

  • Method: X-RAY DIFFRACTION
  • Resolution: 1.85 Å
  • R-Value Free: 0.266 
  • R-Value Work: 0.199 
  • R-Value Observed: 0.202 

wwPDB Validation   3D Report Full Report


This is version 1.3 of the entry. See complete history


Literature

Macromolecules
Find similar proteins by:  (by identity cutoff)  |  3D Structure
Entity ID: 1
MoleculeChains Sequence LengthOrganismDetailsImage
Phosphomannomutase
A, B
246Trypanosoma bruceiMutation(s): 0 
Gene Names: Tb10.70.0370TB10.700.370
EC: 5.4.2.8
UniProt
Find proteins for Q38AW2 (Trypanosoma brucei brucei (strain 927/4 GUTat10.1))
Explore Q38AW2 
Go to UniProtKB:  Q38AW2
Entity Groups  
Sequence Clusters30% Identity50% Identity70% Identity90% Identity95% Identity100% Identity
UniProt GroupQ38AW2
Sequence Annotations
Expand
  • Reference Sequence
Experimental Data & Validation

Experimental Data

  • Method: X-RAY DIFFRACTION
  • Resolution: 1.85 Å
  • R-Value Free: 0.266 
  • R-Value Work: 0.199 
  • R-Value Observed: 0.202 
  • Space Group: P 21 21 2
Unit Cell:
Length ( Å )Angle ( ˚ )
a = 105.927α = 90
b = 46.994β = 90
c = 94.494γ = 90
Software Package:
Software NamePurpose
DENZOdata reduction
SCALEPACKdata scaling
PHASERphasing
REFMACrefinement
PDB_EXTRACTdata extraction

Structure Validation

View Full Validation Report


Entry History 

Revision History  (Full details and data files)

  • Version 1.0: 2009-03-10
    Type: Initial release
  • Version 1.1: 2011-07-13
    Changes: Version format compliance
  • Version 1.2: 2017-11-01
    Changes: Refinement description
  • Version 1.3: 2023-12-27
    Changes: Data collection, Database references, Derived calculations