3D5E

Crystal structure of human plasma platelet activating factor acetylhydrolase covalently inhibited by paraoxon


Experimental Data Snapshot

  • Method: X-RAY DIFFRACTION
  • Resolution: 2.10 Å
  • R-Value Free: 0.261 
  • R-Value Work: 0.204 
  • R-Value Observed: 0.207 

wwPDB Validation   3D Report Full Report


This is version 1.2 of the entry. See complete history


Literature

Crystal Structure of Human Plasma Platelet-activating Factor Acetylhydrolase: STRUCTURAL IMPLICATION TO LIPOPROTEIN BINDING AND CATALYSIS.

Samanta, U.Bahnson, B.J.

(2008) J Biol Chem 283: 31617-31624

  • DOI: https://doi.org/10.1074/jbc.M804750200
  • Primary Citation of Related Structures:  
    3D59, 3D5E

  • PubMed Abstract: 

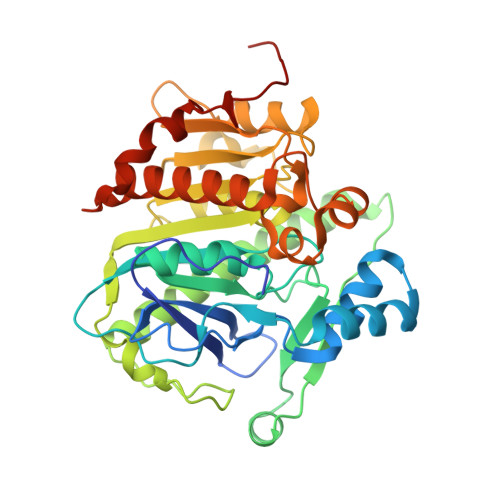
    Human plasma platelet-activating factor (PAF) acetylhydrolase functions by reducing PAF levels as a general anti-inflammatory scavenger and is linked to anaphylactic shock, asthma, and allergic reactions. The enzyme has also been implicated in hydrolytic activities of other pro-inflammatory agents, such as sn-2 oxidatively fragmented phospholipids. This plasma enzyme is tightly bound to low and high density lipoprotein particles and is also referred to as lipoprotein-associated phospholipase A2. The crystal structure of this enzyme has been solved from x-ray diffraction data collected to a resolution of 1.5 angstroms. It has a classic lipase alpha/beta-hydrolase fold, and it contains a catalytic triad of Ser273, His351, and Asp296. Two clusters of hydrophobic residues define the probable interface-binding region, and a prediction is given of how the enzyme is bound to lipoproteins. Additionally, an acidic patch of 10 carboxylate residues and a neighboring basic patch of three residues are suggested to play a role in high density lipoprotein/low density lipoprotein partitioning. A crystal structure is also presented of PAF acetylhydrolase reacted with the organophosphate compound paraoxon via its active site Ser273. The resulting diethyl phosphoryl complex was used to model the tetrahedral intermediate of the substrate PAF to the active site. The model of interface binding begins to explain the known specificity of lipoprotein-bound substrates and how the active site can be both close to the hydrophobic-hydrophilic interface and at the same time be accessible to the aqueous phase.


  • Organizational Affiliation

    Department of Chemistry & Biochemistry, University of Delaware, Newark, Delaware 19716, USA.


Macromolecules
Find similar proteins by:  (by identity cutoff)  |  3D Structure
Entity ID: 1
MoleculeChains Sequence LengthOrganismDetailsImage
Platelet-activating factor acetylhydrolase
A, B
383Homo sapiensMutation(s): 0 
Gene Names: PLA2G7PAFAH
EC: 3.1.1.47
UniProt & NIH Common Fund Data Resources
Find proteins for Q13093 (Homo sapiens)
Explore Q13093 
Go to UniProtKB:  Q13093
PHAROS:  Q13093
GTEx:  ENSG00000146070 
Entity Groups  
Sequence Clusters30% Identity50% Identity70% Identity90% Identity95% Identity100% Identity
UniProt GroupQ13093
Sequence Annotations
Expand
  • Reference Sequence
Small Molecules
Ligands 2 Unique
IDChains Name / Formula / InChI Key2D Diagram3D Interactions
DEP
Query on DEP

Download Ideal Coordinates CCD File 
C [auth A],
K [auth B]
DIETHYL PHOSPHONATE
C4 H11 O3 P
MJUJXFBTEFXVKU-UHFFFAOYSA-N
FMT
Query on FMT

Download Ideal Coordinates CCD File 
D [auth A]
E [auth A]
F [auth A]
G [auth A]
H [auth A]
D [auth A],
E [auth A],
F [auth A],
G [auth A],
H [auth A],
I [auth A],
J [auth A],
L [auth B],
M [auth B],
N [auth B],
O [auth B],
P [auth B],
Q [auth B],
R [auth B],
S [auth B],
T [auth B]
FORMIC ACID
C H2 O2
BDAGIHXWWSANSR-UHFFFAOYSA-N
Experimental Data & Validation

Experimental Data

  • Method: X-RAY DIFFRACTION
  • Resolution: 2.10 Å
  • R-Value Free: 0.261 
  • R-Value Work: 0.204 
  • R-Value Observed: 0.207 
  • Space Group: C 1 2 1
Unit Cell:
Length ( Å )Angle ( ˚ )
a = 117.213α = 90
b = 78.696β = 101.61
c = 97.34γ = 90
Software Package:
Software NamePurpose
MOLREPphasing
REFMACrefinement
HKL-2000data reduction
HKL-2000data scaling
REFMACphasing

Structure Validation

View Full Validation Report


Entry History 

Deposition Data

Revision History  (Full details and data files)

  • Version 1.0: 2008-09-09
    Type: Initial release
  • Version 1.1: 2011-07-13
    Changes: Version format compliance
  • Version 1.2: 2023-08-30
    Changes: Data collection, Database references, Derived calculations, Refinement description