3MYZ

Protein induced photophysical changes to the amyloid indicator dye, thioflavin T


Experimental Data Snapshot

  • Method: X-RAY DIFFRACTION
  • Resolution: 1.60 Å
  • R-Value Free: 0.223 
  • R-Value Work: 0.189 
  • R-Value Observed: 0.191 

wwPDB Validation   3D Report Full Report


Ligand Structure Quality Assessment 


This is version 1.2 of the entry. See complete history


Literature

Protein-induced photophysical changes to the amyloid indicator dye thioflavin T.

Wolfe, L.S.Calabrese, M.F.Nath, A.Blaho, D.V.Miranker, A.D.Xiong, Y.

(2010) Proc Natl Acad Sci U S A 107: 16863-16868

  • DOI: https://doi.org/10.1073/pnas.1002867107
  • Primary Citation of Related Structures:  
    3MYZ, 3MZT

  • PubMed Abstract: 

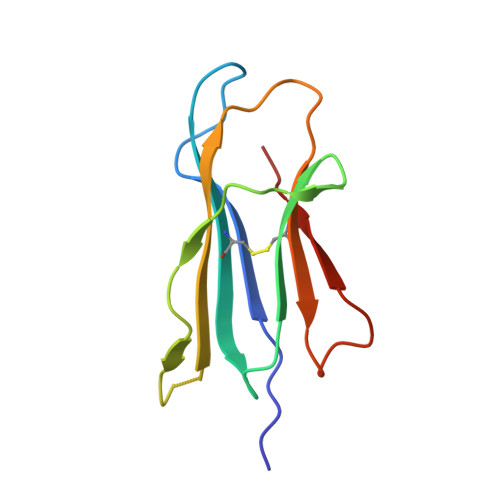
    The small molecule thioflavin T (ThT) is a defining probe for the identification and mechanistic study of amyloid fiber formation. As such, ThT is fundamental to investigations of serious diseases such as Alzheimer's disease, Parkinson disease, and type II diabetes. For each disease, a different protein undergoes conformational conversion to a β-sheet rich fiber. The fluorescence of ThT exhibits an increase in quantum yield upon binding these fibers. Despite its widespread use, the structural basis for binding specificity and for the changes to the photophysical properties of ThT remain poorly understood. Here, we report the co-crystal structures of ThT with two alternative states of β-2 microglobulin (β2m); one monomeric, the other an amyloid-like oligomer. In the latter, the dye intercalates between β-sheets orthogonal to the β-strands. Importantly, the fluorophore is bound in such a manner that a photophysically relevant torsion is limited to a range of angles generally associated with low, not high, quantum yield. Quantum mechanical assessment of the fluorophore shows the electronic distribution to be strongly stabilized by aromatic interactions with the protein. Monomeric β2m gives little increase in ThT fluorescence despite showing three fluorophores, at two binding sites, in configurations generally associated with high quantum yield. Our efforts fundamentally extend existing understanding about the origins of amyloid-induced photophysical changes. Specifically, the β-sheet interface that characterizes amyloid acts both sterically and electronically to stabilize the fluorophore's ground state electronic distribution. By preventing the fluorophore from adopting its preferred excited state configuration, nonradiative relaxation pathways are minimized and quantum yield is increased.


  • Organizational Affiliation

    Department of Molecular Biophysics and Biochemistry, Yale University, 260 Whitney Avenue, New Haven, CT 06520-8114, USA.


Macromolecules
Find similar proteins by:  (by identity cutoff)  |  3D Structure
Entity ID: 1
MoleculeChains Sequence LengthOrganismDetailsImage
Beta-2-microglobulin
A, B
100Homo sapiensMutation(s): 1 
Gene Names: B2MCDABP0092HDCMA22P
UniProt & NIH Common Fund Data Resources
Find proteins for P61769 (Homo sapiens)
Explore P61769 
Go to UniProtKB:  P61769
PHAROS:  P61769
GTEx:  ENSG00000166710 
Entity Groups  
Sequence Clusters30% Identity50% Identity70% Identity90% Identity95% Identity100% Identity
UniProt GroupP61769
Sequence Annotations
Expand
  • Reference Sequence
Small Molecules
Ligands 4 Unique
IDChains Name / Formula / InChI Key2D Diagram3D Interactions
TFX
Query on TFX

Download Ideal Coordinates CCD File 
D [auth A],
E [auth A],
I [auth B]
2-[4-(dimethylamino)phenyl]-3,6-dimethyl-1,3-benzothiazol-3-ium
C17 H19 N2 S
FXEKRIDRIFBJOR-UHFFFAOYSA-N
HG
Query on HG

Download Ideal Coordinates CCD File 
C [auth A]MERCURY (II) ION
Hg
BQPIGGFYSBELGY-UHFFFAOYSA-N
TLA
Query on TLA

Download Ideal Coordinates CCD File 
F [auth A]L(+)-TARTARIC ACID
C4 H6 O6
FEWJPZIEWOKRBE-JCYAYHJZSA-N
ACT
Query on ACT

Download Ideal Coordinates CCD File 
G [auth A],
H [auth A],
J [auth B]
ACETATE ION
C2 H3 O2
QTBSBXVTEAMEQO-UHFFFAOYSA-M
Experimental Data & Validation

Experimental Data

  • Method: X-RAY DIFFRACTION
  • Resolution: 1.60 Å
  • R-Value Free: 0.223 
  • R-Value Work: 0.189 
  • R-Value Observed: 0.191 
  • Space Group: P 1 21 1
Unit Cell:
Length ( Å )Angle ( ˚ )
a = 48.349α = 90
b = 28.467β = 91.42
c = 74.983γ = 90
Software Package:
Software NamePurpose
HKL-2000data collection
PHASERphasing
REFMACrefinement
HKL-2000data reduction
HKL-2000data scaling

Structure Validation

View Full Validation Report


Ligand Structure Quality Assessment 


Entry History 

Deposition Data

Revision History  (Full details and data files)

  • Version 1.0: 2010-09-08
    Type: Initial release
  • Version 1.1: 2011-07-13
    Changes: Version format compliance
  • Version 1.2: 2023-09-06
    Changes: Data collection, Database references, Derived calculations, Refinement description