Autocatalytic maturation, physical/chemical properties, and crystal structure of group N HIV-1 protease: relevance to drug resistance.
Sayer, J.M., Agniswamy, J., Weber, I.T., Louis, J.M.(2010) Protein Sci 19: 2055-2072
- PubMed: 20737578
- DOI: https://doi.org/10.1002/pro.486
- Primary Citation of Related Structures:
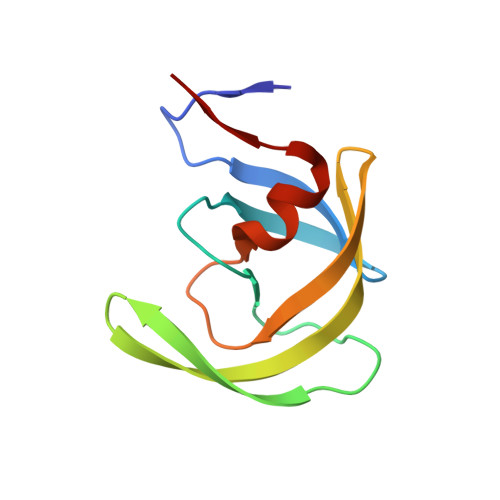
3MWS - PubMed Abstract:
The mature protease from Group N human immunodeficiency virus Type 1 (HIV-1) (PR1(N)) differs in 20 amino acids from the extensively studied Group M protease (PR1(M)) at positions corresponding to minor drug-resistance mutations (DRMs). The first crystal structure (1.09 Å resolution) of PR1(N) with the clinical inhibitor darunavir (DRV) reveals the same overall structure as PR1(M), but with a slightly larger inhibitor-binding cavity. Changes in the 10s loop and the flap hinge propagate to shift one flap away from the inhibitor, whereas L89F and substitutions in the 60s loop perturb inhibitor-binding residues 29-32. However, kinetic parameters of PR1(N) closely resemble those of PR1(M), and calorimetric results are consistent with similar binding affinities for DRV and two other clinical PIs, suggesting that minor DRMs coevolve to compensate for the detrimental effects of drug-specific major DRMs. A miniprecursor (TFR 1-61-PR1(N)) comprising the transframe region (TFR) fused to the N-terminus of PR1(N) undergoes autocatalytic cleavage at the TFR/PR1(N) site concomitant with the appearance of catalytic activity characteristic of the dimeric, mature enzyme. This cleavage is inhibited at an equimolar ratio of precursor to DRV (∼6 μM), which partially stabilizes the precursor dimer from a monomer. However, cleavage at L34/W35 within the TFR, which precedes the TFR 1-61/PR1(N) cleavage at pH ≤ 5, is only partially inhibited. Favorable properties of PR1(N) relative to PR1(M) include its suitability for column fractionation by size under native conditions and >10-fold higher dimer dissociation constant (150 nM). Exploiting these properties may facilitate testing of potential dimerization inhibitors that perturb early precursor processing steps.
Organizational Affiliation:
Laboratory of Chemical Physics, National Institute of Diabetes and Digestive and Kidney Diseases, National Institutes of Health, DHHS, Bethesda, Maryland 20892-0520, USA.