


Crystal structure of CutA1 from Oryza sativa
Kezuka, Y., Bagautdinov, B., Katoh, S., Ohtake, Y., Yutani, K., Nonaka, T., Katoh, E.To be published.
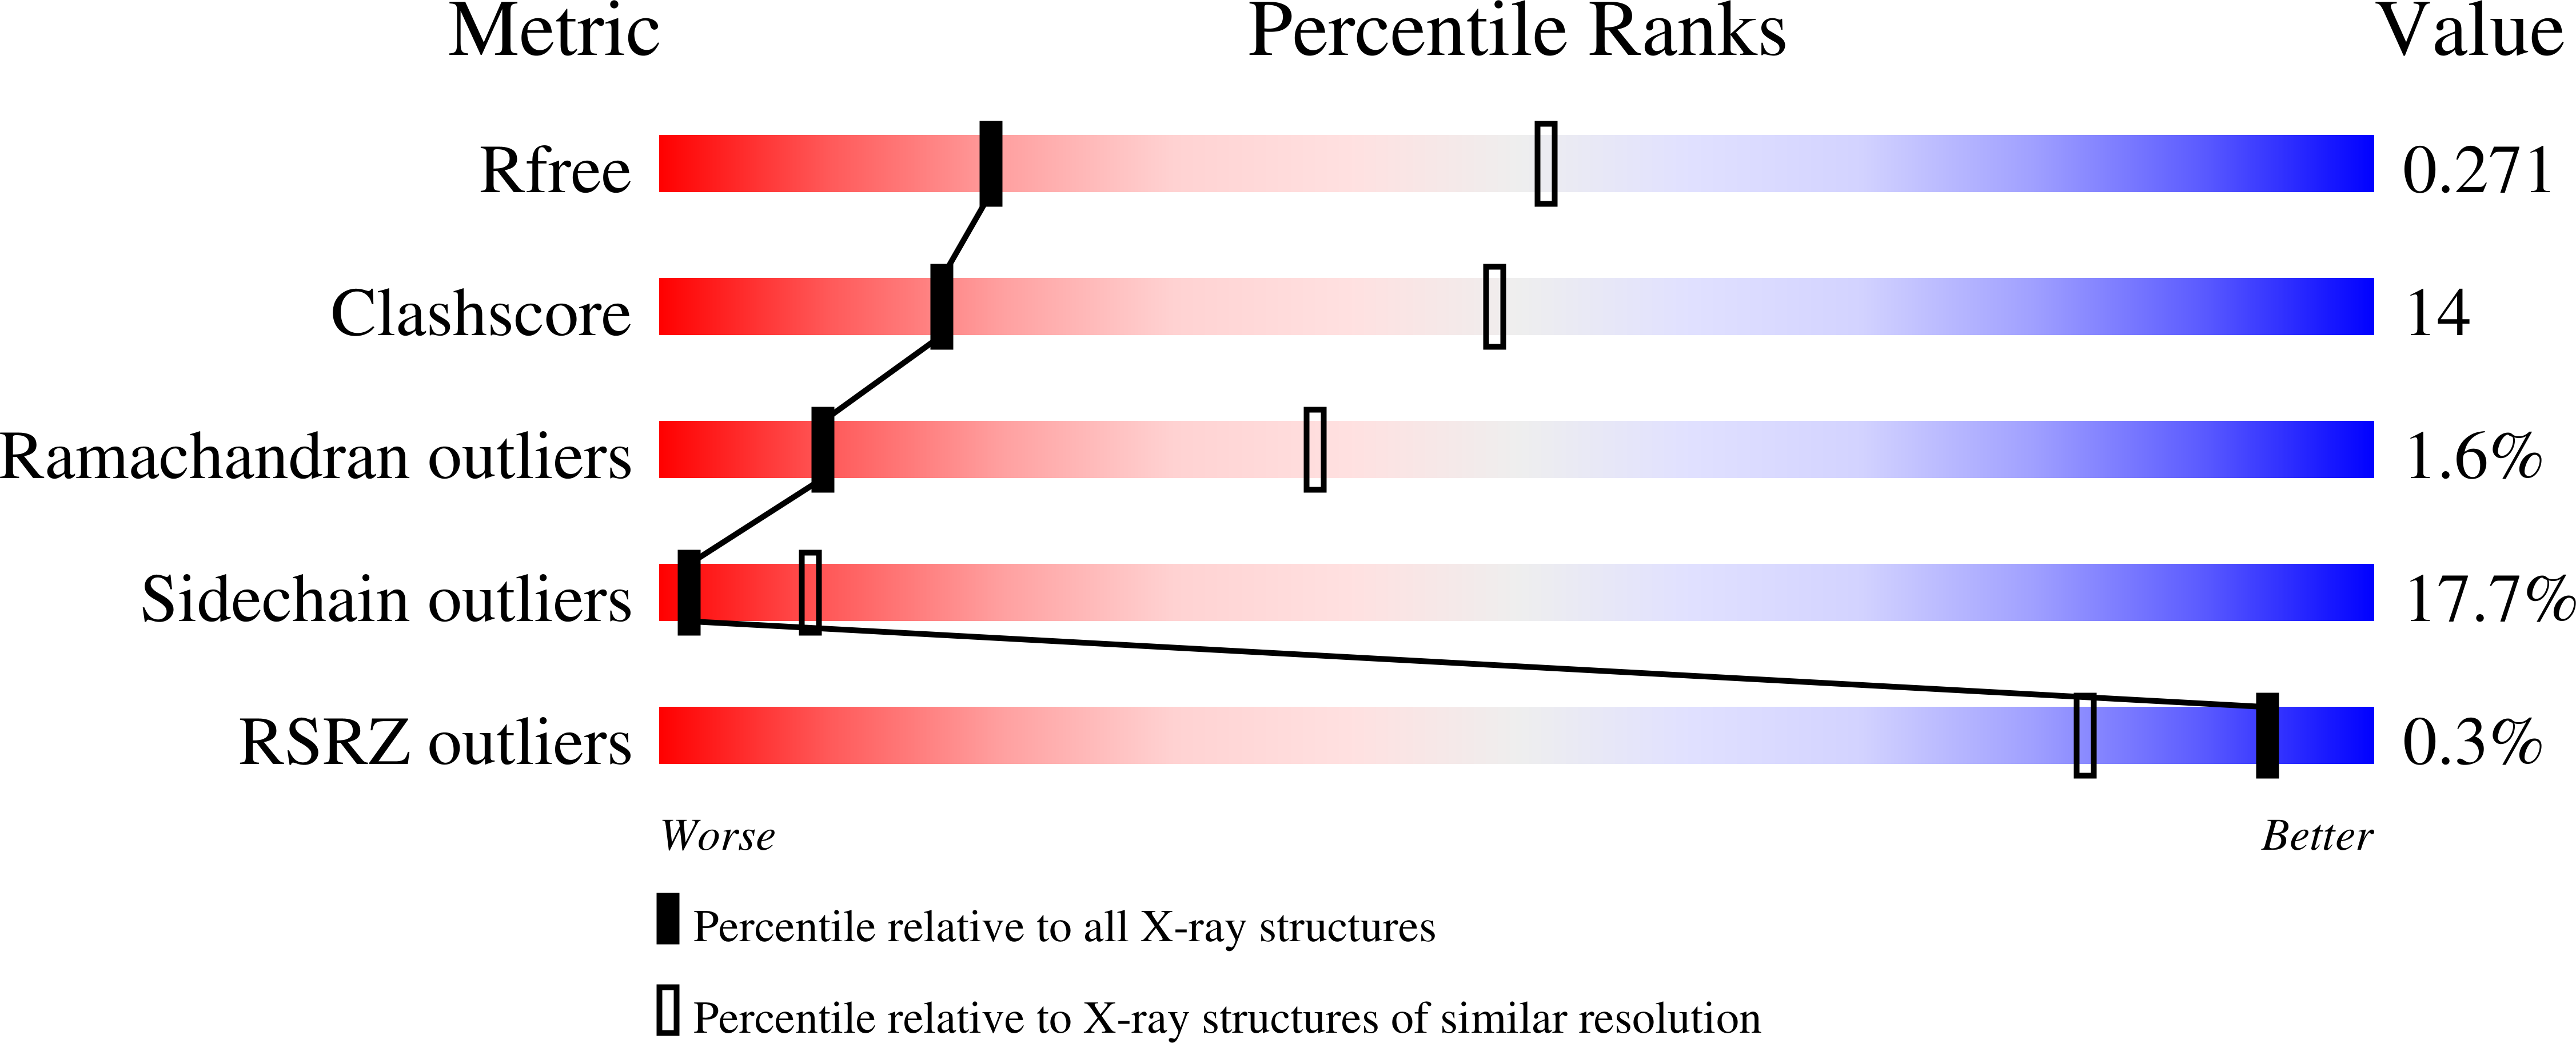
Experimental Data Snapshot
wwPDB Validation 3D Report Full Report
Entity ID: 1 | |||||
|---|---|---|---|---|---|
| Molecule | Chains | Sequence Length | Organism | Details | Image |
| Protein CutA, chloroplast, putative, expressed | 113 | Oryza sativa Japonica Group | Mutation(s): 0 |  | |
UniProt | |||||
Find proteins for Q109R6 (Oryza sativa subsp. japonica) Explore Q109R6 Go to UniProtKB: Q109R6 | |||||
Entity Groups | |||||
| Sequence Clusters | 30% Identity50% Identity70% Identity90% Identity95% Identity100% Identity | ||||
| UniProt Group | Q109R6 | ||||
Sequence AnnotationsExpand | |||||
| |||||
| Ligands 2 Unique | |||||
|---|---|---|---|---|---|
| ID | Chains | Name / Formula / InChI Key | 2D Diagram | 3D Interactions | |
| SO4 Query on SO4 | E [auth A], G [auth B], I [auth C] | SULFATE ION O4 S QAOWNCQODCNURD-UHFFFAOYSA-L |  | ||
| GOL Query on GOL | D [auth A], F [auth B], H [auth C] | GLYCEROL C3 H8 O3 PEDCQBHIVMGVHV-UHFFFAOYSA-N |  | ||
| Length ( Å ) | Angle ( ˚ ) |
|---|---|
| a = 127.214 | α = 90 |
| b = 127.214 | β = 90 |
| c = 121.868 | γ = 90 |
| Software Name | Purpose |
|---|---|
| REFMAC | refinement |
| MOSFLM | data reduction |
| SCALA | data scaling |
| MOLREP | phasing |
RCSB PDB (citation) is hosted by
RCSB PDB is a member of the

