Relationship between the Size of the Bottleneck 15 a from Iron in the Main Channel and the Reactivity of Catalase Corresponding to the Molecular Size of Substrates.
Hara, I., Ichise, N., Kojima, K., Kondo, H., Ohgiya, S., Matsuyama, H., Yumoto, I.(2007) Biochemistry 46: 11
- PubMed: 17198371
- DOI: https://doi.org/10.1021/bi061519w
- Primary Citation of Related Structures:
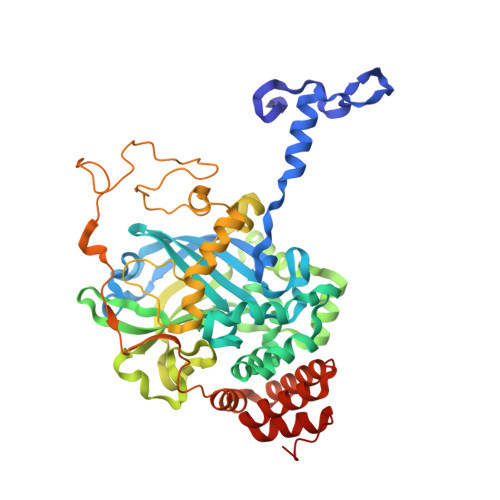
2J2M - PubMed Abstract:
A catalase that exhibits a high level of activity and a rapid reaction with organic peroxides has been purified from Exiguobacterium oxidotolerans T-2-2T (EKTA catalase). The amino acid sequence of EKTA catalase revealed that it is a novel clade 1 catalase. Amino acid residues in the active site around the protoheme are conserved in the primary structure of EKTA catalase. Although the general interactions of molecules larger than hydrogen peroxide with catalases are strongly inhibited because of the selection role of long and narrow channels in the substrate reaching the active site, the formation rate of reactive intermediates (compound I) in the reaction of EKTA catalase with peracetic acid is 77 times higher than that of bovine liver catalase (BLC) and 1200 times higher than that of Micrococcus luteus catalase (MLC). The crystal structure of EKTA catalase has been determined and refined to 2.4 A resolution. The main channel structure of EKTA catalase is different from those of BLC and MLC. The rate constant of compound I formation in catalases decreased with an increase in the molecular size of the substrate. For EKTA catalase with a larger bottleneck 15 A from the iron (entrance of narrow channel) in the main channel, a lower rate of reduction in compound I formation rate with an increase in the molecular size of substrates was found. The increase in the rate constant of compound I formation in these catalases was directly proportional to the increase in the size of the bottleneck in the main channel when molecules of substrates larger than H2O2, such as organic peroxides, are used in the reaction. The results indicate that the size of the bottleneck in the main channel in catalase is an important factor in defining the rate of compound I formation corresponding to the molecular size of the substrates, and this was demonstrated. The Leu149-Ile180 and Asp109-Met167 combinations at the entrance of the narrow channel in EKTA catalase determine the size of the bottleneck, and each atom-to-atom distance for the combination of residues was larger than those of corresponding combinations of amino acid residues in BLC and MLC. The combination of these four amino acids is quite specific in EKTA catalase as compared with the combinations in other catalases in the gene database (compared with more than 432 catalase genes in the database).
Organizational Affiliation:
Research Institute of Genome-based Biofactory, National Institute of Advanced Industrial Science and Technology (AIST), Tsukisamu-Higashi, Toyohira-ku, Sapporo 062-8517, Japan.