2F43

Rat liver F1-ATPase


Experimental Data Snapshot

  • Method: X-RAY DIFFRACTION
  • Resolution: 3.00 Å
  • R-Value Free: 0.320 
  • R-Value Work: 0.306 
  • R-Value Observed: 0.306 

wwPDB Validation   3D Report Full Report


Ligand Structure Quality Assessment 


This is version 1.3 of the entry. See complete history


Literature

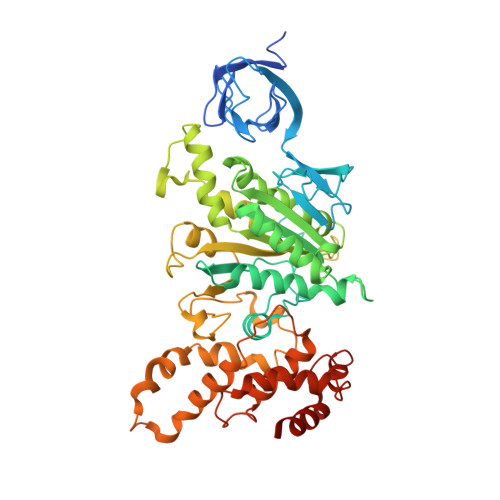
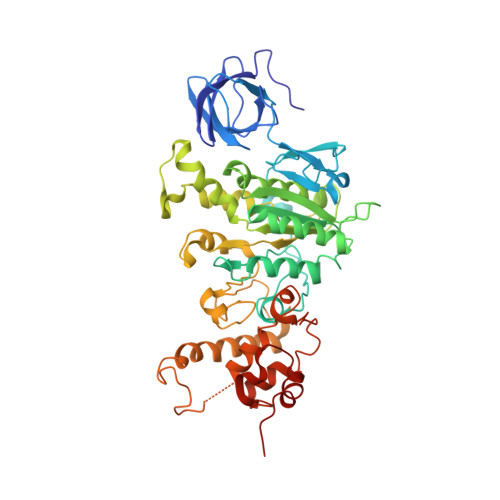
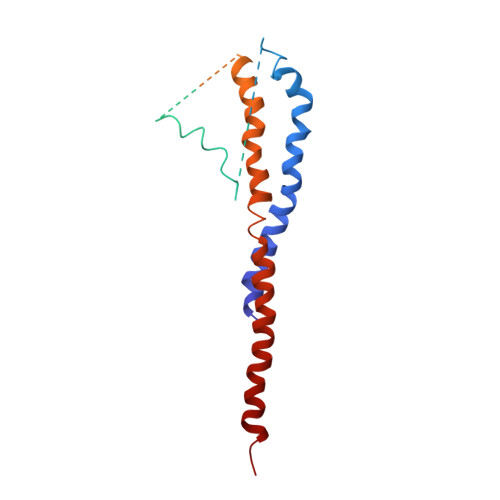
Mitochondrial ATP synthase: Crystal structure of the catalytic F1 unit in a vanadate-induced transition-like state and implications for mechanism.

Chen, C.Saxena, A.K.Simcoke, W.N.Garboczi, D.N.Pedersen, P.L.Ko, Y.H.

(2006) J Biol Chem 281: 13777-13783

  • DOI: https://doi.org/10.1074/jbc.M513369200
  • Primary Citation of Related Structures:  
    2F43

  • PubMed Abstract: 

    ATP synthesis from ADP, P(i), and Mg2+ takes place in mitochondria on the catalytic F1 unit (alpha3beta3gammedeltaepsilon) of the ATP synthase complex (F0F1), a remarkable nanomachine that interconverts electrochemical and mechanical energy, producing the high energy terminal bond of ATP. In currently available structural models of F1, the P-loop (amino acid residues 156GGAGVGKT163) contributes to substrate binding at the subunit catalytic sites. Here, we report the first transition state-like structure of F1 (ADP.V(i).Mg.F1) from rat liver that was crystallized with the phosphate (P(i)) analog vanadate (VO(3-)4 or V(i)). Compared with earlier "ground state" structures, this new F1 structure reveals that the active site region has undergone significant remodeling. P-loop residue alanine 158 is located much closer to V(i) than it is to P(i) in a previous structural model. No significant movements of P-loop residues of the subunit were observed at its analogous but noncatalytic sites. Under physiological conditions, such active site remodeling involving the small hydrophobic alanine residue may promote ATP synthesis by lowering the local dielectric constant, thus facilitating the dehydration of ADP and P(i). This new crystallographic study provides strong support for the catalytic mechanism of ATP synthesis deduced from earlier biochemical studies of liver F1 conducted in the presence of V(i) (Ko, Y. H., Bianchet, M., Amzel, L. M., and Pedersen, P. L. (1997) J. Biol. Chem. 272, 18875-18881; Ko, Y. H., Hong, S., and Pedersen, P. L. (1999) J. Biol. Chem. 274, 28853-28856).


  • Organizational Affiliation

    Department of Biological Chemistry, Johns Hopkins University School of Medicine, Baltimore, Maryland 21205-2185.


Macromolecules
Find similar proteins by:  (by identity cutoff)  |  3D Structure
Entity ID: 1
MoleculeChains Sequence LengthOrganismDetailsImage
ATP synthase alpha chain, mitochondrial510Rattus norvegicusMutation(s): 0 
EC: 3.6.3.14
UniProt
Find proteins for P15999 (Rattus norvegicus)
Explore P15999 
Go to UniProtKB:  P15999
Entity Groups  
Sequence Clusters30% Identity50% Identity70% Identity90% Identity95% Identity100% Identity
UniProt GroupP15999
Sequence Annotations
Expand
  • Reference Sequence
Find similar proteins by:  (by identity cutoff)  |  3D Structure
Entity ID: 2
MoleculeChains Sequence LengthOrganismDetailsImage
ATP synthase beta chain, mitochondrial479Rattus norvegicusMutation(s): 0 
EC: 3.6.3.14
UniProt
Find proteins for P10719 (Rattus norvegicus)
Explore P10719 
Go to UniProtKB:  P10719
Entity Groups  
Sequence Clusters30% Identity50% Identity70% Identity90% Identity95% Identity100% Identity
UniProt GroupP10719
Sequence Annotations
Expand
  • Reference Sequence
Find similar proteins by:  (by identity cutoff)  |  3D Structure
Entity ID: 3
MoleculeChains Sequence LengthOrganismDetailsImage
ATP synthase gamma chain, mitochondrialC [auth G]273Rattus norvegicusMutation(s): 0 
EC: 3.6.3.14
UniProt
Find proteins for P35435 (Rattus norvegicus)
Explore P35435 
Go to UniProtKB:  P35435
Entity Groups  
Sequence Clusters30% Identity50% Identity70% Identity90% Identity95% Identity100% Identity
UniProt GroupP35435
Sequence Annotations
Expand
  • Reference Sequence
Experimental Data & Validation

Experimental Data

  • Method: X-RAY DIFFRACTION
  • Resolution: 3.00 Å
  • R-Value Free: 0.320 
  • R-Value Work: 0.306 
  • R-Value Observed: 0.306 
  • Space Group: H 3 2
Unit Cell:
Length ( Å )Angle ( ˚ )
a = 144.567α = 90
b = 144.567β = 90
c = 362.982γ = 120
Software Package:
Software NamePurpose
MOSFLMdata reduction
SCALAdata scaling
MOLREPphasing
CNSrefinement
CCP4data scaling

Structure Validation

View Full Validation Report


Ligand Structure Quality Assessment 


Entry History 

Deposition Data

Revision History  (Full details and data files)

  • Version 1.0: 2006-03-07
    Type: Initial release
  • Version 1.1: 2008-05-01
    Changes: Version format compliance
  • Version 1.2: 2011-07-13
    Changes: Version format compliance
  • Version 1.3: 2023-08-23
    Changes: Data collection, Database references, Derived calculations, Refinement description