2XFX

cattle MHC class I N01301 presenting an 11mer from Theileria parva


Experimental Data Snapshot

  • Method: X-RAY DIFFRACTION
  • Resolution: 1.90 Å
  • R-Value Free: 0.238 
  • R-Value Work: 0.198 
  • R-Value Observed: 0.200 

wwPDB Validation   3D Report Full Report


This is version 1.2 of the entry. See complete history


Literature

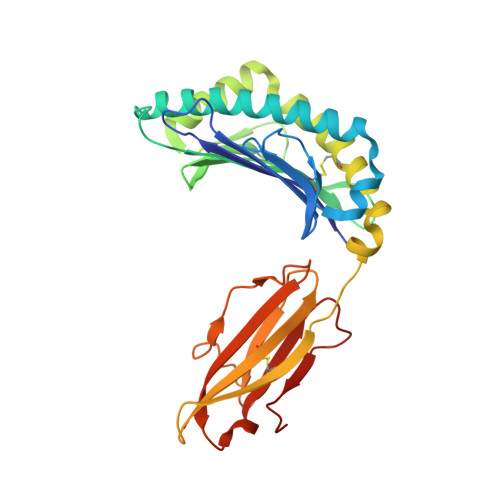
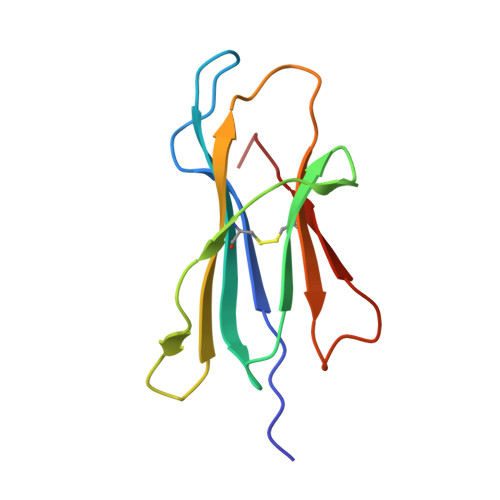
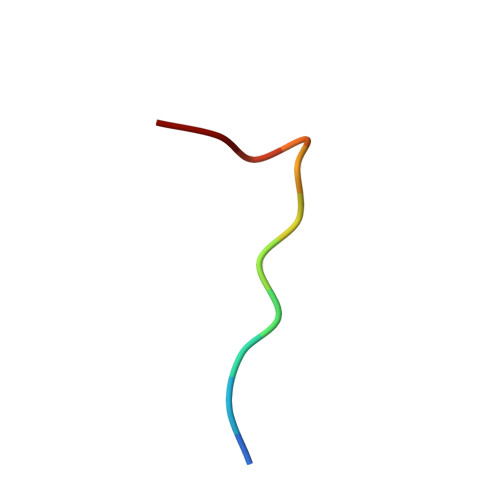
Mhc Class I Bound to an Immunodominant Theileria Parva Epitope Demonstrates Unconventional Presentation to T Cell Receptors.

Macdonald, I.K.Harkiolaki, M.Hunt, L.Connelley, T.Carroll, A.V.Machugh, N.D.Graham, S.P.Jones, E.Y.Morrison, W.I.Flower, D.R.Ellis, S.A.

(2010) PLoS Pathog 6: 01149

  • DOI: https://doi.org/10.1371/journal.ppat.1001149
  • Primary Citation of Related Structures:  
    2XFX

  • PubMed Abstract: 

    T cell receptor (TCR) recognition of peptide-MHC class I (pMHC) complexes is a crucial event in the adaptive immune response to pathogens. Peptide epitopes often display a strong dominance hierarchy, resulting in focusing of the response on a limited number of the most dominant epitopes. Such T cell responses may be additionally restricted by particular MHC alleles in preference to others. We have studied this poorly understood phenomenon using Theileria parva, a protozoan parasite that causes an often fatal lymphoproliferative disease in cattle. Despite its antigenic complexity, CD8+ T cell responses induced by infection with the parasite show profound immunodominance, as exemplified by the Tp1(214-224) epitope presented by the common and functionally important MHC class I allele N*01301. We present a high-resolution crystal structure of this pMHC complex, demonstrating that the peptide is presented in a distinctive raised conformation. Functional studies using CD8+ T cell clones show that this impacts significantly on TCR recognition. The unconventional structure is generated by a hydrophobic ridge within the MHC peptide binding groove, found in a set of cattle MHC alleles. Extremely rare in all other species, this feature is seen in a small group of mouse MHC class I molecules. The data generated in this analysis contribute to our understanding of the structural basis for T cell-dependent immune responses, providing insight into what determines a highly immunogenic p-MHC complex, and hence can be of value in prediction of antigenic epitopes and vaccine design.


  • Organizational Affiliation

    The Jenner Institute, University of Oxford, Compton, Berkshire, United Kingdom.


Macromolecules
Find similar proteins by:  (by identity cutoff)  |  3D Structure
Entity ID: 1
MoleculeChains Sequence LengthOrganismDetailsImage
MHC CLASS 1277Bos taurusMutation(s): 0 
UniProt
Find proteins for Q30291 (Bos taurus)
Explore Q30291 
Go to UniProtKB:  Q30291
Entity Groups  
Sequence Clusters30% Identity50% Identity70% Identity90% Identity95% Identity100% Identity
UniProt GroupQ30291
Sequence Annotations
Expand
  • Reference Sequence
Find similar proteins by:  (by identity cutoff)  |  3D Structure
Entity ID: 2
MoleculeChains Sequence LengthOrganismDetailsImage
BETA-2-MICROGLOBULIN99Bos taurusMutation(s): 0 
UniProt
Find proteins for P01888 (Bos taurus)
Explore P01888 
Go to UniProtKB:  P01888
Entity Groups  
Sequence Clusters30% Identity50% Identity70% Identity90% Identity95% Identity100% Identity
UniProt GroupP01888
Sequence Annotations
Expand
  • Reference Sequence

Find similar proteins by:  Sequence   |   3D Structure  

Entity ID: 3
MoleculeChains Sequence LengthOrganismDetailsImage
UNCHARACTERIZED PROTEIN11Theileria parvaMutation(s): 0 
UniProt
Find proteins for Q4MYJ2 (Theileria parva)
Explore Q4MYJ2 
Go to UniProtKB:  Q4MYJ2
Entity Groups  
Sequence Clusters30% Identity50% Identity70% Identity90% Identity95% Identity100% Identity
UniProt GroupQ4MYJ2
Sequence Annotations
Expand
  • Reference Sequence
Experimental Data & Validation

Experimental Data

  • Method: X-RAY DIFFRACTION
  • Resolution: 1.90 Å
  • R-Value Free: 0.238 
  • R-Value Work: 0.198 
  • R-Value Observed: 0.200 
  • Space Group: P 21 21 21
Unit Cell:
Length ( Å )Angle ( ˚ )
a = 44.611α = 90
b = 97.888β = 90
c = 123.717γ = 90
Software Package:
Software NamePurpose
REFMACrefinement
HKL-2000data reduction
SCALEPACKdata scaling
AMoREphasing

Structure Validation

View Full Validation Report


Entry History 

Deposition Data

Revision History  (Full details and data files)

  • Version 1.0: 2010-10-27
    Type: Initial release
  • Version 1.1: 2012-03-28
    Changes: Data collection, Database references, Derived calculations, Version format compliance
  • Version 1.2: 2023-12-20
    Changes: Data collection, Database references, Other, Refinement description