256B

IMPROVEMENT OF THE 2.5 ANGSTROMS RESOLUTION MODEL OF CYTOCHROME B562 BY REDETERMINING THE PRIMARY STRUCTURE AND USING MOLECULAR GRAPHICS


Experimental Data Snapshot

  • Method: X-RAY DIFFRACTION
  • Resolution: 1.40 Å
  • R-Value Observed: 0.164 

wwPDB Validation   3D Report Full Report


Ligand Structure Quality Assessment 


This is version 1.5 of the entry. See complete history


Literature

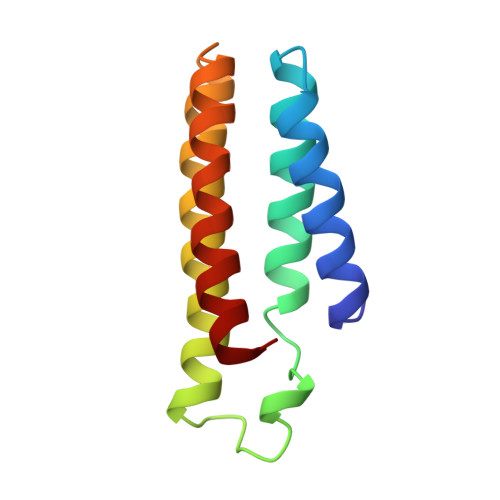
Improvement of the 2.5 A resolution model of cytochrome b562 by redetermining the primary structure and using molecular graphics.

Lederer, F.Glatigny, A.Bethge, P.H.Bellamy, H.D.Matthew, F.S.

(1981) J Mol Biol 148: 427-448


Macromolecules
Find similar proteins by:  (by identity cutoff)  |  3D Structure
Entity ID: 1
MoleculeChains Sequence LengthOrganismDetailsImage
CYTOCHROME B562
A, B
106Escherichia coliMutation(s): 0 
UniProt
Find proteins for P0ABE7 (Escherichia coli)
Explore P0ABE7 
Go to UniProtKB:  P0ABE7
Entity Groups  
Sequence Clusters30% Identity50% Identity70% Identity90% Identity95% Identity100% Identity
UniProt GroupP0ABE7
Sequence Annotations
Expand
  • Reference Sequence
Experimental Data & Validation

Experimental Data

  • Method: X-RAY DIFFRACTION
  • Resolution: 1.40 Å
  • R-Value Observed: 0.164 
  • Space Group: P 1
Unit Cell:
Length ( Å )Angle ( ˚ )
a = 33.71α = 102.76
b = 50.48β = 86.55
c = 32.73γ = 106.7
Software Package:
Software NamePurpose
PROFFTrefinement

Structure Validation

View Full Validation Report


Ligand Structure Quality Assessment 


Entry History 

Deposition Data

Revision History  (Full details and data files)

  • Version 1.0: 1991-01-15
    Type: Initial release
  • Version 1.1: 2008-03-03
    Changes: Version format compliance
  • Version 1.2: 2011-07-13
    Changes: Version format compliance
  • Version 1.3: 2014-08-27
    Changes: Derived calculations
  • Version 1.4: 2017-11-29
    Changes: Derived calculations, Other
  • Version 1.5: 2024-02-14
    Changes: Data collection, Database references, Derived calculations